Everything you need to understand before you look at a chart seriously. Fourteen chapters that lay out the vocabulary, the mechanisms and the orders of magnitude — no needless jargon, and nothing passed over in silence.
01 What is trading?
Let's start at the beginning, without assuming you already know anything. Trading is simple to describe and demanding to do — and the gap between the two explains a good part of the disappointment that follows.
Trading means buying and selling financial assets — currencies, stocks, indexes, commodities, cryptocurrencies — in order to profit from movements in their price. The word says it plainly: to trade is to exchange. At its barest, that is exactly what it is: you exchange one asset for another, hoping the value moves in your favor.
What separates trading from long-term investing is not the nature of the operation but its horizon. The investor buys a share of a company and waits years. The trader looks to exploit shorter moves, from a few minutes to a few weeks. Both approaches are legitimate; they call for neither the same skills nor the same temperament.
A trade always unfolds in the same order
Whatever the market or the method, the sequence never changes. It is worth learning by heart right now, because every step you skip creates a problem further down the line.
The five stages of a trade. Beginners dwell almost entirely on the entry decision; yet it is the management and the exit that decide the outcome.
The three pillars
Trading is often reduced to chart analysis. That is the visible part, and by far the least decisive. Three skills combine, and weakness in one cancels out the strength of the others.
Analysis
Reading what price is doing and spotting the situations where your method has an edge. It is what everyone works on first — and what matters least.
Risk management
Deciding what each position is allowed to cost you, before you open it. It is what keeps you in the game long enough for the analysis to be worth anything.
Discipline
Doing what you decided to do, including when it is uncomfortable. It is the least taught pillar, and the one that breaks most often.
An image helps to grasp the hierarchy. A pilot knows aerodynamics, but what lands the plane without incident is the procedures and their methodical application, even on a tired day. Trading works the same way: knowledge opens the door, procedure keeps you alive.
What this module will not do. It will not hand you a ready-made method, an indicator setting or a signal. It lays out the vocabulary and the mechanisms. That foundation is what will let you judge for yourself the value of whatever you are offered elsewhere — and you will be offered a great deal.
Worth remembering
Trading exploits price movements over a short horizon; investing aims at value over years.
The sequence of a trade is always the same: analysis, decision, entry, management, exit.
Analysis, risk management and discipline work together. The most neglected of the three is discipline.
Put it into practice
Set your starting point
1Write down in one sentence why trading interests you. That sentence will be your marker when motivation wavers.
2Note how much time you can give it each week, honestly. That will decide your style later on, far more than your preferences will.
3Decide now that you will risk no real money before you have finished the Basics and Risk management modules.
02 Trading or investing
This question deserves to be settled straight away, because the answer determines everything else: the time you will spend, the skills to acquire, and what you can reasonably expect to earn. Many people want to trade when their situation clearly calls for investing.
The investor buys an asset for what it produces: a company that generates profits, an index that captures the growth of an economy. They accept holding for years and pay no attention to daily swings. The trader buys in order to sell again: what interests them is the price difference between entry and exit.
Investing
Trading
Horizon
years
minutes to weeks
Weekly time
1 to 2 hours a month
5 to 20 hours
Dominant skill
patience, consistency
discipline, execution
Leverage
usually none
common, and dangerous
Benchmark historical return
~7 to 8%/year on global indexes
widely dispersed, negative for most
Tax treatment
can be optimized (PEA, France's tax-advantaged share account; long term)
frequent capital gains
The 7 to 8% figure is the average historical annualized return of the major global stock indexes, dividends reinvested, over long periods. It is not guaranteed.
The comparison nobody makes
The debate is usually framed as a choice of style. It should first be framed as a calculation. Here are the two paths, with assumptions deliberately favorable to the trader.
The two do not rule each other out. The soundest combination is to build a base of regular long-term investing, and to allocate to trading only the fraction of your wealth you could lose in full without consequence. That structure protects you from needing to win — and needing to win is the worst adviser there is.
Worked example
Twenty years, two approaches
Marie invests. Thomas trades. Both start from zero and put in €300 a month. The assumptions used for Thomas are those of a trader who succeeds — which, let us remember, is the minority.
Inputs
Monthly contribution
€300
Duration
20 years
Marie — vehicle
global stock ETF
Marie — assumed return
7%/year
Marie — time spent
2 hours a month
Thomas — time spent
3 hours a day
Calculation
Marie — capital paid in: 300 × 12 × 20 = €72,000
Marie — final value at 7% compounded: ≈ €156,000
Marie — total time invested: 2 × 12 × 20 = 480 hours
Thomas — total time invested: 3 × 250 days × 20 = 15,000 hours
To match Marie, Thomas has to make ≈ €156,000 net of costs and tax
Set against her time: Marie "earns" ≈ €175 per hour invested
Thomas would have to make ≈ €10 per hour to draw level
ResultMarie: ≈ €156,000 for 480 hours · Thomas: 15,000 hours to hope for as much
This calculation does not say that trading is pointless. It says that trading has to justify itself by something other than return: intellectual interest, a taste for the markets, a professional plan. If your goal is only to grow your savings, passive investing is mathematically more efficient, and infinitely less demanding.
Worth remembering
Investing aims at what the asset produces; trading aims at the price difference.
Set against the time it takes, passive investing is very hard to beat.
The healthy structure: a base invested for the long term, and in trading only what you can afford to lose.
Put it into practice
Clarify your goal
1Answer in writing: am I trying to grow my savings, or to learn a trade? Both answers are valid, but they do not call for the same activity.
2If it is the first, open a regular investment plan before you go any further — and keep this course to understand the markets.
3If it is the second, set right now the maximum amount you are prepared to lose in full. That is your trading capital, and nothing else.
03 The markets you can access
Five broad families of markets are open to retail traders. They do not have the same hours, the same volatility or the same costs. Choosing yours is not a detail: it is what makes your practice compatible — or not — with your real life.
The five families and their orders of magnitude. Volume traded is not a measure of quality: it tells you the liquidity, and so how easily you can get in and out without taking a bad price.
Forex, the currency market
It is the largest market in the world, with more than $7 trillion traded every day. What changes hands there are currency pairs: buying EUR/USD amounts to buying euros while selling dollars. It is open twenty-four hours a day from Sunday evening to Friday evening.
Its advantages for a beginner are real: enormous liquidity, low costs on the main pairs, access with a small account. Its danger is just as real: leverage is widely available there, and that is precisely what empties accounts.
The major pairs. EUR/USD, GBP/USD, USD/JPY, USD/CHF, AUD/USD, NZD/USD and USD/CAD account for most of the volume and offer the tightest spreads. A beginner has no reason to venture elsewhere: exotic pairs cost far more to trade.
Indexes, stocks, commodities, crypto
Indexes — S&P 500, CAC 40, Nasdaq — represent a basket of stocks. They avoid the risk attached to a single company and follow trends that are easier to read. They trade during exchange hours, with extended hours depending on the broker.
Stocks expose you to the risk specific to one company: a disappointing quarterly result can send the share down 15% in a single session, however good your chart analysis. They require you to follow the company's news.
Commodities — gold, oil, wheat — answer to physical supply and demand, to geopolitics and to the seasons. Gold also plays the role of a safe haven, which makes it sensitive to interest rates and to crises.
Cryptocurrencies are open at all times, weekends included, and show volatility on a scale unlike any other market. Moves of 10% in a day are ordinary there. That volatility attracts; it is also what makes the market merciless when leverage is poorly handled.
How to choose
The right market is the one that is open when you are available. That is the first criterion, and it already rules out a great many options. If you can only follow the markets after 9 p.m., European stocks are out of reach; Forex on the US session, or crypto, remain available.
The second criterion is cost relative to your capital. On a small account, Forex and index CFDs allow positions of a suitable size. On cash stocks, a properly sized position can be impossible to build with a few hundred euros.
Worked example
How much capital you need, market by market
The question is not "can I open an account?" but "can I size a position properly?". Here is the minimum capital needed to respect a 1% rule with a realistically sized stop, market by market.
Inputs
Risk rule
1% per position
Forex — typical stop
25 pips
Index CFD — typical stop
40 points
Cash stock — typical stop
3% of the price
Bitcoin — typical stop
3% of the price
Calculation
Forex — smallest size: 0.01 lot, that is €0.10/pip
Forex — smallest possible loss: 25 × 0.10 = €2.50 → minimum capital €250
Index — smallest size: 0.1 contract, that is €0.10/point
Index — smallest loss: 40 × 0.10 = €4 → minimum capital €400
Stock at €150, 1 share minimum: loss = 150 × 3% = €4.50 → capital €450
Stock at €800 (LVMH, say): loss = €24 → minimum capital €2,400
Bitcoin at $60,000, fraction 0.0001: loss = $0.18 → capital €18
ResultForex €250 · Index €400 · Stocks €450 to €2,400 · Crypto a few tens of euros
The table explains why so many beginners with a small account end up on Forex and crypto: they are the only markets where you can size properly with little. That does not make them easier — quite the opposite, since they are also the ones where leverage is most generous. A modest account on cash stocks forces you to give up expensive shares, which is a healthy constraint.
Worth remembering
The first criterion for choosing is the clock: the market has to be open when you are available.
Forex offers liquidity and low costs, but it is also where leverage does the most damage.
Crypto volatility is not an advantage in itself: it amplifies mistakes as much as successes.
Put it into practice
Choose one market, and only one
1Note the slots you are genuinely available in over a typical week, hour by hour.
2Cross them with the hours in the next chapter and keep the market that fits.
3Then choose a single instrument inside that market, and follow it for a month without changing. You learn how an instrument behaves through repetition, not through variety.
04 Market sessions
Forex is open continuously, but it is not active in the same way at every hour. Activity follows the big financial centers, and this daily rhythm determines where the moves are — and where the traps are.
Three sessions follow one another and partly overlap. Each has a recognizable temperament, which you end up sensing once you have watched them long enough.
Session
Hours (Paris)
Temperament
Most active instruments
Asia (Tokyo)
1:00 — 10:00
Quiet, narrow ranges, low volatility
USD/JPY, AUD/USD, NZD/USD
London
9:00 — 18:00
High volatility, heavy volume, directional moves
EUR/USD, GBP/USD, EUR/GBP
New York
14:30 — 23:00
High volatility, reaction to US data releases
all dollar pairs, US indexes
London–New York overlap
14:30 — 18:00
The heaviest volume of the day
EUR/USD, GBP/USD, gold, indexes
The overlap window between London and New York concentrates most of the daily volume. That is where the moves are cleanest, where spreads are tightest, and where technical levels hold best. If you can only trade one hour a day, that is the one to choose.
The Asian session, by contrast, often produces narrow ranges. Applying a method designed for clean moves there amounts to multiplying false breakouts.
The hours to avoid when you are starting out. The London session open and the release of the big US figures produce very fast moves, with widened spreads and sometimes fills at a price other than the one you asked for. These are moments when a beginner loses money without the analysis being at fault. Wait thirty minutes after the open, and stay away from major releases.
The economic calendar
Some releases move markets almost mechanically: central bank rate decisions, US employment figures, inflation. These events are known weeks in advance and are listed on free economic calendars.
The minimum practice, for a beginner, fits in a single sentence: check each morning whether a major release is due that day, and don't open a position in the thirty minutes around it. That doesn't require understanding the numbers — only knowing they're coming.
Worked example
The same method, two different time windows
A trader applies a breakout method to EUR/USD with a 15-pip stop. He compares two months: the first in the Asian session, the second on the London–New York overlap.
Inputs
Method
range breakout
Stop
15 pips
Target
30 pips (2R)
Trades per month
40
Average range — Asia
~35 pips
Average range — overlap
~90 pips
Calculation
Asia — the daily range (35 pips) leaves little room for a 30-pip target
ResultThe same method: losing in Asia, profitable on the overlap
Nothing changed in the method, or in the trader's skill. Only the time window differs. A 30-pip target makes no sense when the market only covers 35 in a day: the method needs a range the session does not provide. This is the kind of mismatch that leads people to conclude, wrongly, that a method "doesn't work".
Worth remembering
The London–New York overlap, from 14:30 to 18:00, concentrates the volume and the cleanest moves.
The Asian session produces narrow ranges: a method built for wide moves fails there.
Check the economic calendar every morning; open nothing around major releases.
Put it into practice
Set your time window
1Choose the window of at least one hour when you will be available regularly, not occasionally.
2Note your instrument's average range in that window over ten days. Your targets will have to fit inside that range.
3Bookmark an economic calendar and get into the habit of checking it before every session.
05 Order types
An order is the instruction you send to the market. There are four families, and confusing two of them — limit and stop — is one of the most common mistakes of the first few months. Let's take the time to separate them properly.
The market order
It fills immediately, at the best price available. Its virtue is the certainty of being filled; its flaw is the uncertainty about the price you get. In quiet conditions the gap is negligible. During an economic release it can be considerable — this is what's called slippage.
It's the most widely used order, and the right choice when the certainty of getting in matters more than a few tenths of a point.
Pending orders
The other three families only fill if price reaches a level you set. They let you prepare a trade without sitting in front of the screen — and that is what makes them valuable if you have a job on the side.
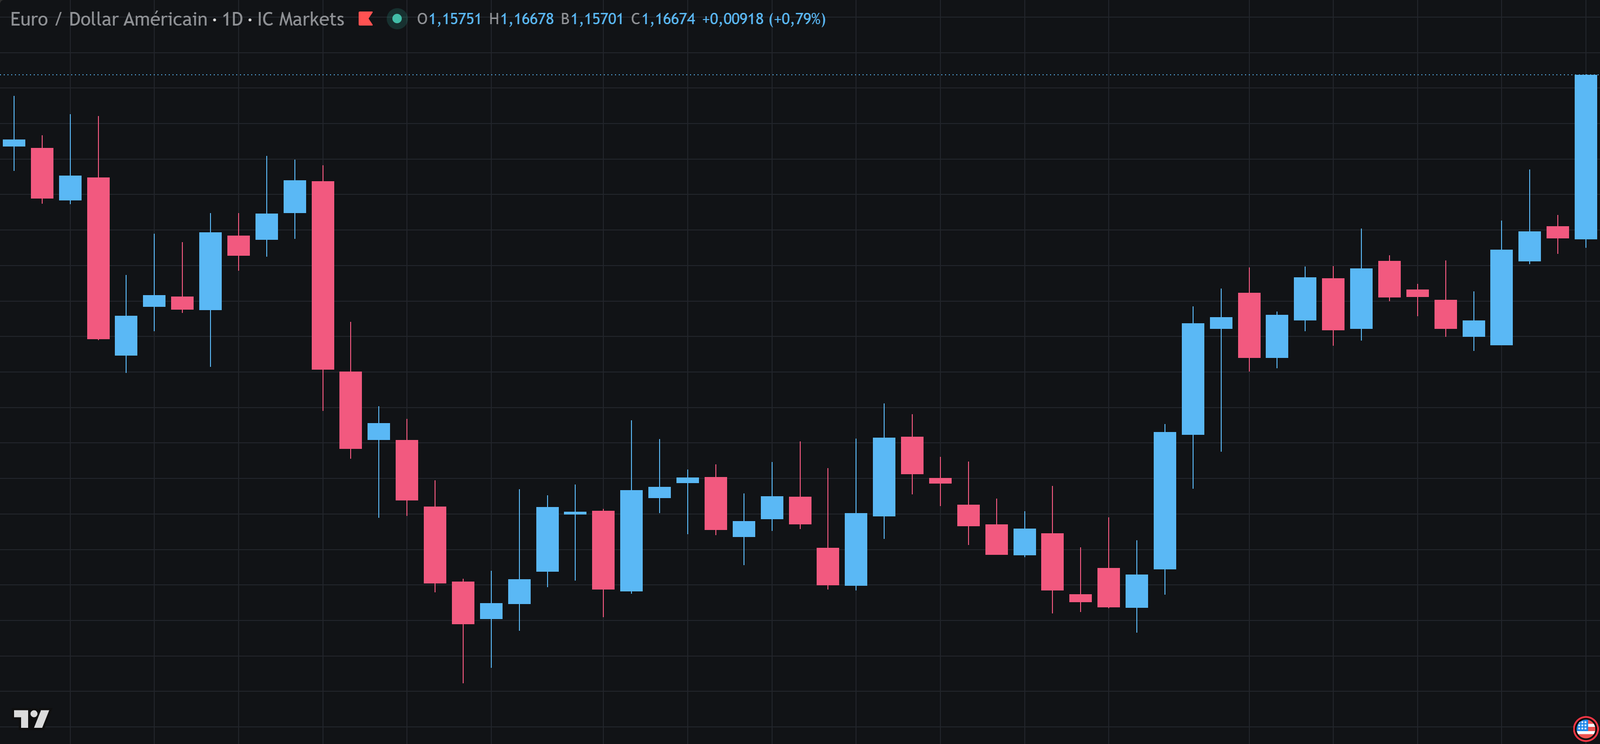
The four pending orders, placed on a real chart. The rule fits in one sentence: a limit order waits for price to come to you — lower to buy, higher to sell; a stop order follows price as it breaks a level — above to buy, below to sell.EUR/USD, daily — chart by TradingView. Past data, with no predictive value.The four pending orders, placed on either side of the current price. The rule is easy to remember: a limit order waits for price to come to you, a stop order follows price as it breaks a level.
Limit order
You place your buy below the current price, or your sell above it. You wait for price to come back to you. The fill happens at your price or better.
Buy limit: buy cheaper
Sell limit: sell higher
Advantage: the price is guaranteed
Risk: price may never come back
Stop order
You place your buy above the current price, or your sell below it. You wait for price to break a level and keep going. The fill happens at the next available price.
Buy stop: buy the upside breakout
Sell stop: sell the downside breakout
Advantage: you follow the move
Risk: the fill price is not guaranteed
Protective orders
Two particular orders go with an open position. The stop-loss closes the position at a set price if the market goes against you: it is your cap on losses, and it gets a full chapter in the Risk management module. The take-profit closes the position at your target.
Most platforms let you enter all three together — entry, stop, target — in a single operation. Take up that habit from day one: it will spare you the classic situation where you open a position promising yourself you will place the stop "right after".
One mnemonic is enough. Limit comes from "limiting the price": you refuse to pay more than your level. Stop comes from "triggering on the break": you accept the market price once the level is broken. Hold on to that distinction and you will not mix them up again.
Worked example
Limit or stop: the same situation, two outcomes
EUR/USD is trading at 1.0800 and has been stalling for three days against resistance at 1.0850. Two traders expect the same thing — a move up — but choose opposite orders. The market rallies cleanly from the London open.
Inputs
Price at decision time
1.0800
Resistance identified
1.0850
Trader A — buy limit
1.0780
Trader B — buy stop
1.0855
Shared target
1.0920
Lowest price reached before the move up
1.0794
Calculation
A — price falls to 1.0794, never touching 1.0780
A — the order does not fill: the trader stays out
B — price breaks 1.0850 and triggers the buy stop
B — actual fill at 1.0858, i.e. 3 points of slippage
B — exit at the 1.0920 target: 1.0920 − 1.0858 = 62 pips
Slippage cost 3 pips, or 4.8% of the gain
ResultA: no trade · B: +62 pips, 3 of them lost to slippage
Neither of them was wrong: they made different bets on the path. The limit order gets a better price but accepts missing the move; the stop order guarantees you are in it but pays for slippage. The choice depends on your method, and it has to be written down in advance — not decided while watching price move.
Worth remembering
Market order: certain fill, uncertain price. Limit order: certain price, uncertain fill.
Limit waits for price to come to you; stop follows price as it breaks a level.
Always enter the entry, the stop and the target in the same operation.
Put it into practice
Work the four orders on a demo account
1Open a demo account and place, one after another, a buy limit, a buy stop, a sell limit and a sell stop on the same instrument.
2Watch which one triggers, which one expires, and at exactly what price the fill happens.
3Then place a market order during a quiet period, and another one just after an economic release. Compare the slippage you get in each case.
4Repeat until choosing the order type takes you no thought at all.
06 Spread, commissions and leverage
Three ideas that determine the real cost of your activity and the size of your swings. The first two are costs, and they are often underestimated. The third is not a cost but a multiplier — and it is the most dangerous of the three.
The spread
At any moment two prices coexist: the one you can sell at, and the slightly higher one you can buy at. The gap between them is called the spread, and it is the main source of income for many brokers.
In practice, a position always starts out down by the amount of the spread. On EUR/USD, a 1-pip spread means price has to move one pip your way simply to get back to break-even. That looks trivial on one trade; over several hundred, it becomes a major cost line.
Commissions
Some accounts apply a very small spread but charge a fixed commission per lot traded. That model is often cheaper for anyone who trades a lot, and more transparent, since the cost is explicit instead of being built into the price.
To compare two offers honestly, you have to add up spread and commission for the same volume. A broker advertising "spreads from 0 pips" is necessarily charging somewhere else.
Model
Typical EUR/USD spread
Commission
Round-trip cost for 1 lot
Account with the spread built in
1.2 pips
none
≈ $12
Account with a commission
0.2 pips
$3.5 per lot per side
≈ $9
Unregulated beginner account
3 pips and up
variable
≈ $30 or more
Indicative orders of magnitude for EUR/USD in normal conditions. Spreads widen sharply around economic releases and at session opens.
Leverage
Leverage lets you control a position worth more than your capital. Leverage of 1:30 means €1,000 of capital drives €30,000 in the market. The broker fronts the difference.
One point has to be very clear: leverage does not change the quality of your analysis, or your expectancy. All it does is multiply the size of your swings, in both directions. It does not improve your chances of succeeding — it increases the speed at which your decisions produce their consequences.
The effect of a 1% move against the position, by the leverage used. At 1:100, that one-percent move — commonplace within a single day — wipes out the entire account.
Why European regulation caps leverage. ESMA, the European securities regulator, limits leverage for retail traders to 30:1 on major currency pairs, and to much less on volatile assets. This limit is not a punishment: it was introduced after it became clear that a large majority of retail accounts were losing money, and that high leverage was the main aggravating factor. Brokers offering 1:500 operate outside that regulation, and in the process deprive you of the protections that come with it.
Worked example
What a year of active trading really costs
A trader takes five positions a week on EUR/USD, with an average size of 0.5 lots. He compares two account structures over a full year.
Annual difference: 1,380 − 1,035 = $345, or 3.5% of capital
Result$1,380 against $1,035 — 3.5% of capital every year
Three and a half percent of capital a year, in cost differences alone. On a method with an annual expectancy of 15%, that is close to a quarter of the performance. Choosing your account model is therefore not an administrative detail: it is a decision that weighs as much as several months of good trades.
Worth remembering
Every position starts out down by the amount of the spread. That cost adds up over hundreds of trades.
To compare two brokers, add spread and commission together for the same volume.
Leverage does not change your expectancy: it only speeds up the consequences of your decisions.
Put it into practice
Work out your annual cost
1Estimate how many positions you take per week and your average size, even roughly.
2Redo the calculation above with your broker's real conditions, which you will find in its contract specifications.
3Express that annual cost as a percentage of your capital. That is the return you have to produce before you earn your first euro.
4If you do not yet know your maximum leverage, check it now, and set it to the lowest level offered.
07 Pips, lots and position size
Here is the vocabulary that lets you measure a move and size a position. This chapter is technical, but it presents no conceptual difficulty: it is convention and arithmetic. Once you have it, it will never cost you any effort again.
The pip
A pip is the smallest usual move in a currency pair. On most pairs it is the fourth decimal place: if EUR/USD goes from 1.0850 to 1.0851, it has gained one pip. On yen pairs, quoted with two decimals, a pip is the second: from 155.20 to 155.21.
Platforms often display an extra decimal, called the point or pipette. A move from 1.08500 to 1.08505 is therefore half a pip. That precision only matters for judging the spread.
The lot
The lot is the unit of volume. One standard lot is 100,000 units of the base currency. Two fractions of it exist, and those are the ones you will use at the start.
Denomination
Units
Pip value on EUR/USD
For what account size
Standard lot
100,000
≈ $10
from €50,000
Mini lot (0.1)
10,000
≈ $1
from €5,000
Micro lot (0.01)
1,000
≈ $0.10
from €500
Nano lot (0.001)
100
≈ $0.01
for practice on a live account
The account sizes shown are what it takes to respect a 1% risk rule with a stop of reasonable size. They are not minimums imposed by brokers.
These three ideas come together in the central calculation of this business, the one that decides how much to buy so that your maximum loss is exactly the one you chose. The Risk management module devotes a whole chapter to it; it is worth having the formula in front of you from now on.
The formula to remember. Position size = Amount risked ÷ (Distance to the stop in pips × Pip value). All three terms are known before you open. If one of them is missing, you are not ready to place the order.
Worked example
From account balance to position size, step by step
You have €3,000, you accept risking 1% per position, and your analysis puts the stop 20 pips from your entry on EUR/USD. What size do you trade?
Inputs
Capital
€3,000
Risk accepted
1%
Distance to the stop
20 pips
Pip value (1 lot)
≈ €10
Instrument
EUR/USD
Calculation
Amount risked: 3,000 × 1% = €30
Loss on 1 lot if the stop is hit: 20 × 10 = €200
Size = 30 ÷ 200 = 0.15 lot
Check: 20 pips × €10 × 0.15 = €30. Correct.
0.15 lot is 15 micro lots: most brokers accept it
Notional value controlled: 0.15 × 100,000 = €15,000, an effective leverage of 5:1
Result0.15 lot — for a risk of exactly €30
Note the last line: this perfectly reasonable position uses an effective leverage of 5 to 1, while the account may allow 30. The leverage available is not the leverage to use. The risk calculation sets the size, and leverage is only a consequence — never a target.
Worth remembering
A pip is the fourth decimal on most pairs, the second on yen pairs.
A standard lot is 100,000 units; the micro lot (0.01) is the working unit for small accounts.
The leverage you end up using is a consequence of the size calculation, never a starting choice.
Put it into practice
Do the calculation five times
1Take the example above and change the account size: €1,000, €5,000, €20,000. Check each time that the loss still lands on 1%.
2Do it again changing the distance to the stop: 10 pips, 40 pips, 80 pips. Watch how the size adjusts in the opposite direction.
3Compare your results with the position calculator on this site.
4Write down the pip value of your main instrument: you will need it on every trade.
08 Japanese candlesticks
The candlestick is the most widespread way of showing price, and by far the richest. A single candle sums up four pieces of information and tells you about a balance of power. Learning to read one means you stop seeing a line and start seeing a market.
Each candle covers a fixed period — a minute, an hour, a day depending on the timeframe you choose — and condenses four prices: the open, the close, the high and the low reached during that period.
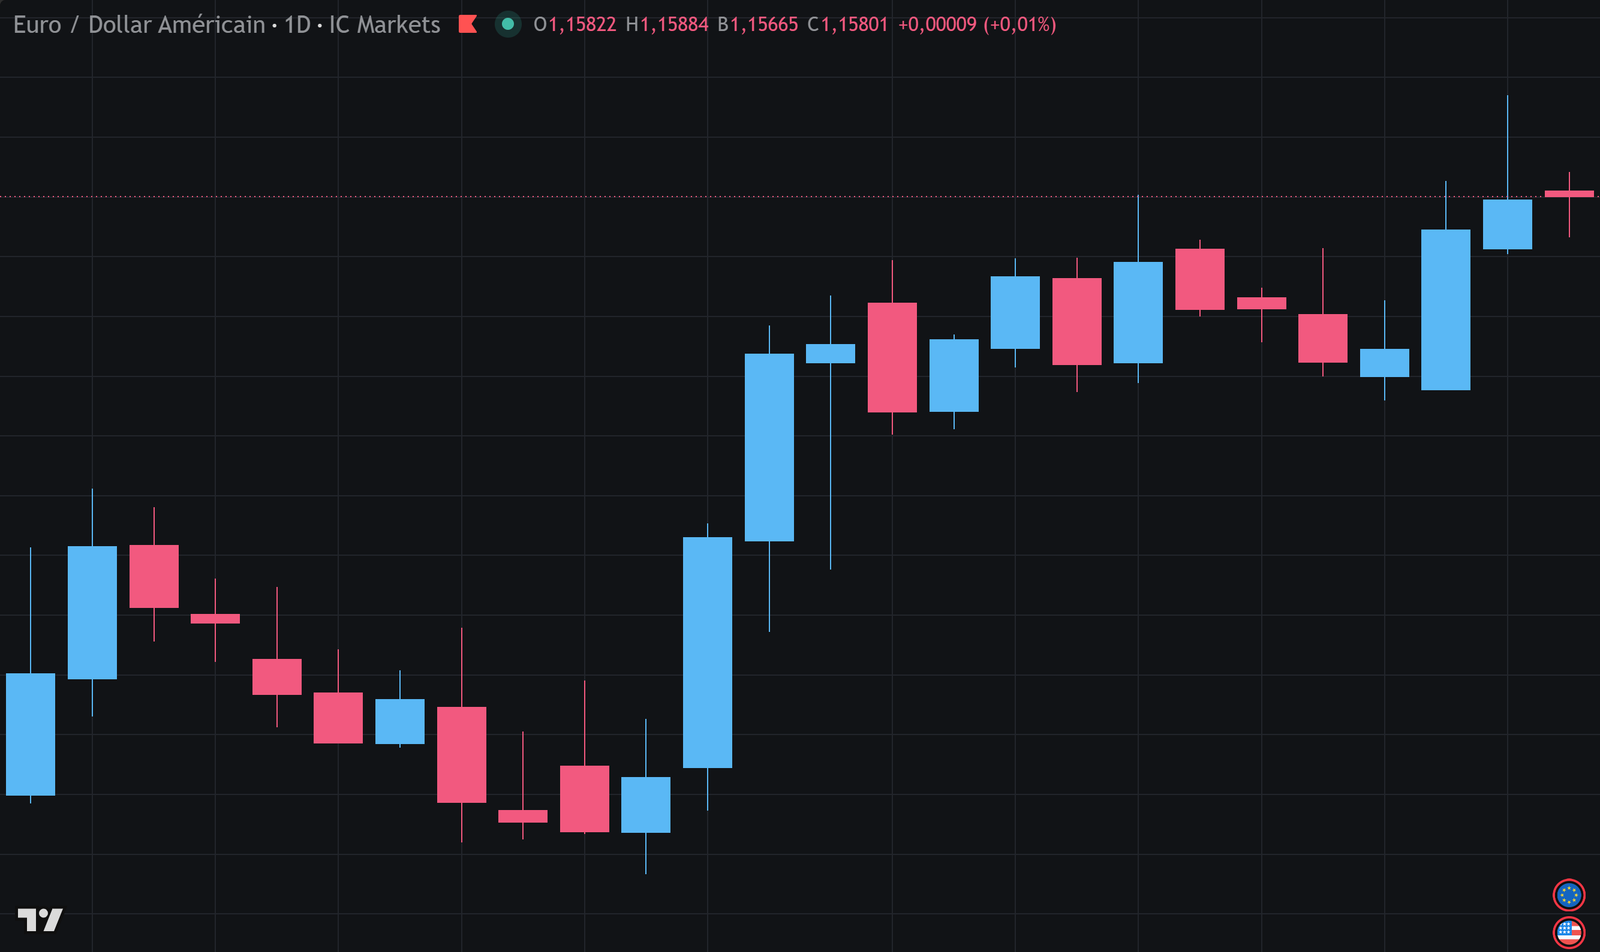
The rectangle in the middle, called the body, joins the open to the close. The thin lines coming out of it, the wicks, mark the extremes. The color tells you the direction: price closed higher than it opened, or lower.
A bullish candle: the close sits above the open. The body measures the net distance travelled, the wicks measure the distance attempted then given up.A bearish candle: the close sits below the open. On both diagrams, the length of the wicks tells you as much as the length of the body.
What the shape tells you
A candle with a large body and small wicks signals a clear direction: buyers or sellers dominated from the start of the period to the end, unchallenged.
A candle with a small body and long wicks tells the opposite story: price went a long way in both directions and came back close to where it started. This is a period of indecision, where neither side gained the upper hand.
A long wick on one side only is especially informative. It shows that price tried to go that way and was pushed back. A long lower wick means sellers pushed, then buyers took control again before the close.
The trap of patterns
The literature on candlesticks is full of patterns with evocative names: hammer, shooting star, engulfing, doji. They describe real configurations, and they are worth knowing.
But you have to avoid a common shortcut: no pattern predicts anything on its own. A hammer in the middle of a clear downtrend does not mean the same thing as a hammer on a major support being tested for the third time. Context is what gives a pattern its meaning — never the pattern alone.
Where to start. Three observations are enough for your first months: the size of the body compared with the candles before it, the presence of a long wick on one side only, and where the candle sits relative to the levels you have marked. You can add the named patterns later, when they come to confirm what you already see.
Twenty-eight real sessions. Every term in this chapter is there: wide bodies where one intention dominates, long wicks where price was pushed back, and dojis with almost no body where neither side wins.EUR/USD, daily — chart by TradingView. Past data, with no predictive value.
Worth remembering
A candle condenses four prices: open, close, high, low.
The body measures the net distance, the wick measures the distance attempted then given up.
No pattern means anything outside its context. The level where it appears matters more than its shape.
Put it into practice
Learn to read, not to recognize
1Open a daily chart and go through thirty candles one by one, from left to right.
2For each one, say out loud what happened: "opened here, pushed up to there, rejected, closed near the low". Look for no pattern.
3Then pick out the five candles with the longest wicks and look at what price did over the next three candles.
4Repeat this exercise ten minutes a day for a week. Reading will become intuitive far faster than it would by learning patterns.
09 Reading a chart
Price does only three things: rise, fall, or hesitate. Being able to say which of those three states you are in is the first habit to build — before any indicator, before any strategy.
The three states of the market
An uptrend is recognized by a precise structure: each low forms higher than the one before, and each high does too. This is not a visual impression, it is a criterion you can check.
A downtrend is the exact mirror image: each high lower, each low lower.
A range, or consolidation, is price swinging between two levels with no clear direction. Neither buyers nor sellers take the upper hand. It is the most common state: the market spends a large part of its time there.
The two trends, read through their structure. Notice that price never advances in a straight line: it moves in impulse legs separated by pullbacks, and it is those pullbacks that create the successive lows.
Why this distinction is decisive
A method designed for a trend fails in a range, and the other way round. Buying pullbacks is excellent in an uptrend and ruinous in a range, where every pullback simply runs to the bottom of the range. Selling resistance is excellent in a range and ruinous in an uptrend.
So the first question to ask in front of a chart is not "where do I enter?" but "which state am I in?". Many methods with a bad reputation are in fact good methods applied in the wrong market state.
Timeframes
The same asset can be bullish on the four-hour and bearish on the fifteen-minute. This is not a contradiction: it is a question of scale. An underlying uptrend necessarily contains pullbacks, and those pullbacks are downtrends on a smaller scale.
The rule for staying consistent is simple and universal: the higher timeframe gives the direction, the lower one gives the moment to enter. You do not take a position against the trend of the higher timeframe just because the lower one invites you to.
Style
Direction timeframe
Entry timeframe
Holding period
Scalping
15 min
1 min
a few minutes
Day trading
1 h — 4 h
5 — 15 min
the session
Swing trading
daily
1 h — 4 h
a few days to weeks
Position trading
weekly
daily
weeks to months
A beginner has every reason to start with swing trading: decisions are rarer, more considered, and costs weigh far less.
The trap of timeframes that are too short. Very short timeframes look attractive because they offer plenty of opportunities. What they actually multiply is three things: costs, decisions to make, and fatigue. Those are exactly the three factors that degrade the quality of your execution. Nobody has ever failed for trading a timeframe that was too slow.
Worth remembering
Three states only: uptrend, downtrend, range. Identify it before anything else.
A trend is read through its structure — successive lows and highs — not through a visual impression.
The higher timeframe gives the direction, the lower one gives the moment. Never the other way round.
Put it into practice
Train your reading of market state
1Open ten different daily charts. For each one, write the state in a single word: uptrend, downtrend or range.
2Justify each answer by naming the last two lows and the last two highs. If you cannot name them, it is probably a range.
3Then drop to the four-hour on the same charts and do the exercise again. Note the cases where the two scales disagree.
4Choose your pair of timeframes according to the time you have available, and do not change it for at least a month.
10 Support and resistance
These are the levels where price has already reacted in the past, and where it stands a good chance of reacting again. It is the most useful concept in all of technical analysis — and one of the most badly used, because people treat it as a line when it is a zone.
A support is a level below price where buyers turned out to outnumber sellers, stopping the fall. A resistance is a level above price where the opposite happened.
There is nothing mystical about them. They come from the memory of the participants: those who bought at that level and saw price rise will want to buy again if it comes back; those who missed the move are watching for a second chance; those who are trapped are waiting to get out at break-even. All three groups concentrate their orders in the same place.
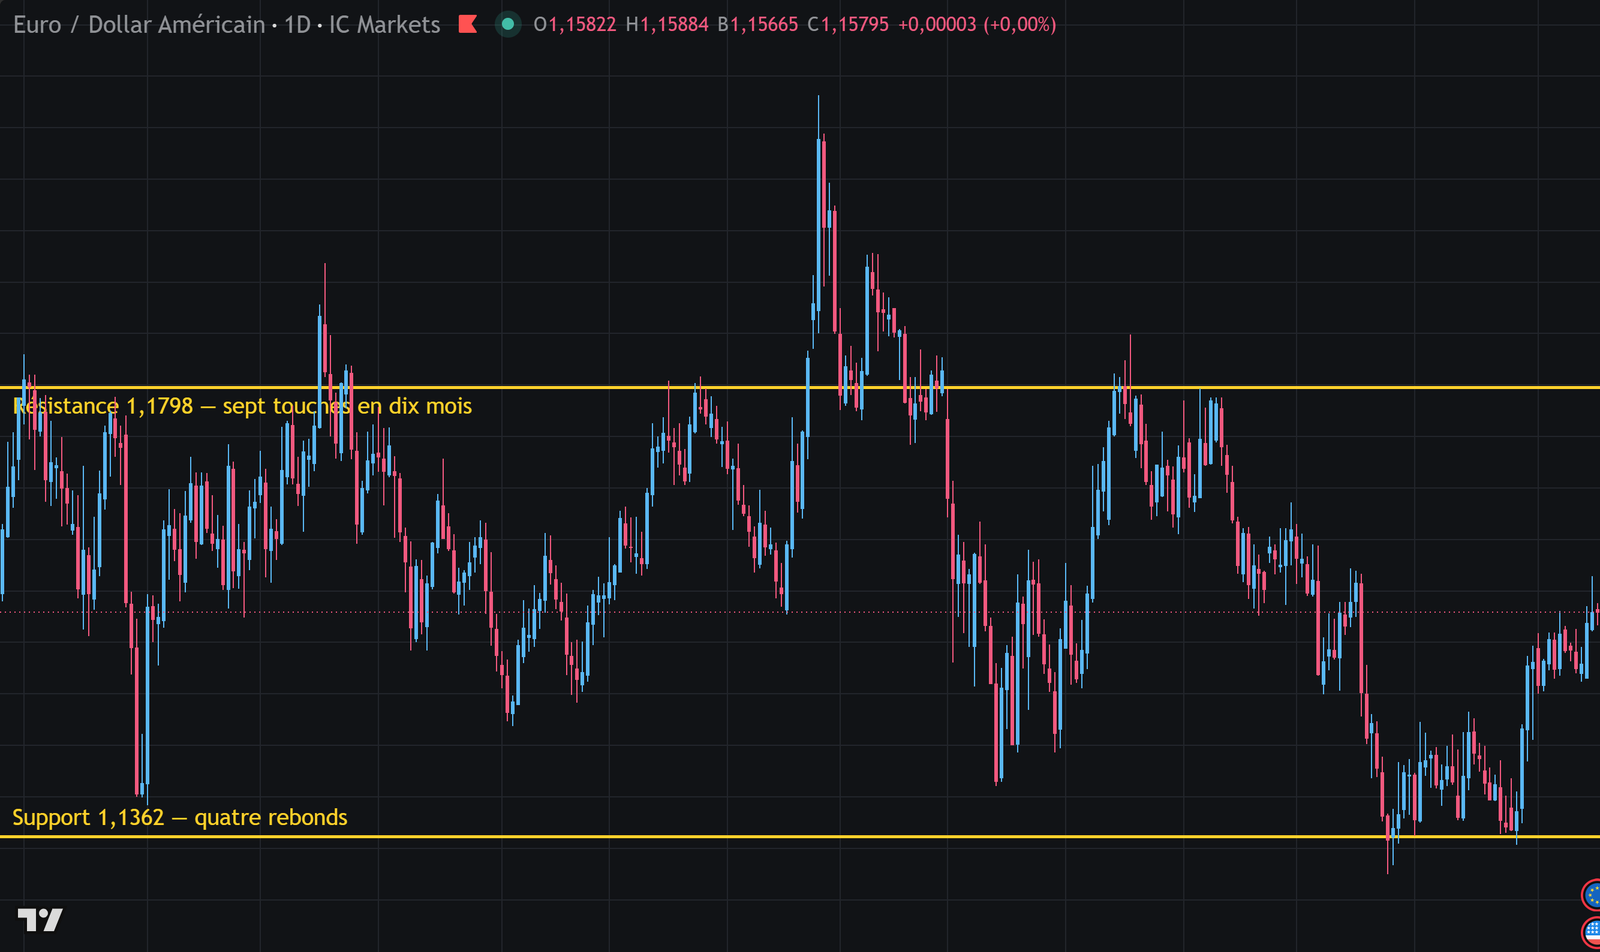
Price runs into the same zones several times. Notice that the wicks push into the zone before price is rejected: a level is never an exact line.
A zone, never a line
This is the most expensive mistake on the subject. Drawing a line to the pixel and placing your stop just behind it guarantees being taken out by the ordinary noise of the market.
Levels are zones whose thickness depends on the volatility of the instrument and on the timeframe. On a daily gold chart, a zone can be several tens of dollars thick. Your stop goes beyond the whole zone, not beyond the line.
What makes a level important
The number of touches. A level touched three times without giving way counts for more than a level touched once.
The timeframe. A level visible on the weekly carries more weight than a level visible on the five-minute.
Age. A level that has held for six months is more significant than a level formed yesterday.
The reaction it produced. A violent rejection points to a zone that is defended; a soft touch points to a fragile one.
The polarity flip
When a support finally gives way, it frequently becomes a resistance — and the other way round. The mechanism is logical: those who were buying at that level lost, and many will look to get out at break-even if price comes back, creating selling pressure where there used to be demand.
This is one of the most useful setups for a beginner: wait for a level to give way, then wait for price to come back and test it from the other side. It takes patience, which is precisely the quality to build.
How many levels to draw. Three to five per chart, no more. A chart covered in lines no longer tells you anything: it ends up confirming whatever idea you already had in mind. If you are hesitating about keeping a level, delete it.
Fourteen months of quotes. Price stalls seven times at 1.1798 without ever settling above it, and bounces four times off 1.1362. Nobody drew these lines in advance: they are read afterwards, in the repetition.EUR/USD, daily — chart by TradingView. Past data, with no predictive value.
Worked example
The stop inside the zone, or beyond it
Two traders buy at the same price, on the same support, with the same analysis. One puts the stop on the line he drew, the other beyond the whole zone. A wick reaches down to the bottom of the zone before price moves back up.
Inputs
Support zone
1.0740 — 1.0760
Shared entry
1.0765
Trader A — stop
1.0755 (inside the zone)
Trader B — stop
1.0730 (below the zone)
Low reached by the wick
1.0742
Target
1.0860
Calculation
A — risk: 1.0765 − 1.0755 = 10 pips
A — the wick drops to 1.0742: the stop is hit → −10 pips
B — risk: 1.0765 − 1.0730 = 35 pips
B — the wick at 1.0742 does not reach 1.0730: the position holds
B — price moves back up and reaches 1.0860 → +95 pips, or +2.7R
On €100 of risk: A loses €100, B gains €271
ResultA: −1R · B: +2.7R — same analysis, same entry
A's tighter stop gave a better reward-to-risk ratio on paper. In reality it took him out of the trade before his scenario had any chance to play out. That is the trap of the optimized stop: an attractive ratio is worth nothing if the stop sits inside the normal noise of the market. The whole zone has to be behind you, even if it means reducing size to compensate.
Worth remembering
A level is a zone whose thickness depends on volatility. The stop goes beyond the whole zone.
A level's importance comes from the number of touches, the timeframe, its age and the violence of the rejection.
A broken support often becomes resistance. That return is one of the clearest setups for a beginner.
Put it into practice
Draw, then check
1On your main instrument, on the daily, draw at most five zones — not lines, rectangles.
2For each one, note the number of touches and the date it formed.
3Every morning for two weeks, check whether price reacted to any of them, and how.
4Delete without regret the ones price went straight through: they existed only in your drawing.
11 Technical analysis and fundamental analysis
Two ways of understanding a market, often presented as rivals. They actually answer two different questions, and a serious trader cannot ignore either one entirely.
Technical analysis studies price itself: its structure, its levels, its history. It starts from the principle that everything known is already reflected in price, and so it sets out to read behavior rather than causes. It answers the question: where and when do I act?
Fundamental analysis studies the causes: interest rates, growth, company earnings, physical supply and demand. It sets out to decide whether an asset is expensive or cheap given what drives it. It answers the question: why should price move?
Technical analysis
Gives precise entry and exit points
Applies to every market in the same way
Says nothing about causes, so shocks catch you off guard
Stops working on sudden, disruptive moves
Fundamental analysis
Explains the broad directions and how durable they are
Anticipates high-risk scheduled events
Gives no precise entry point
Can be right for months before price follows
How to combine them without making life difficult
For a short-term trader, the sensible split is lopsided. Technical analysis does most of the decision-making work: levels, structure, entry timing. Fundamentals serve mainly as a safety filter — knowing that a central bank decision lands this afternoon is enough to avoid half of the nasty surprises.
So there is no need to become an economist. Check an economic calendar, know the three or four releases that move your instrument, and stay out of the market around them: that covers most of what you need.
Release
Markets affected
Frequency
Impact
Rate decision (Fed, ECB)
all currency pairs, indexes, gold
about 8 times a year
very high
US employment (NFP)
dollar pairs, US indexes, gold
monthly, first Friday
very high
Inflation (CPI)
dollar pairs, gold, bonds
monthly
high
Quarterly earnings
the stock concerned, its sector
quarterly
high on that stock
About technical indicators. Moving averages, the RSI, the MACD and their like are not new sources of information: they are mathematical transformations of price, presenting differently what is already on your screen. They can help structure a reading, but none of them holds information that price does not already hold. Two indicators you understand well are worth more than six stacked on top of each other.
Worth remembering
Technical analysis answers "where and when to act", fundamental analysis answers "why price would move".
For a short-term trader, fundamentals serve mainly as a safety filter around scheduled releases.
A technical indicator creates no information: it restates price. Two are plenty.
Put it into practice
Build your minimal fundamental filter
1Identify the three releases that move your main instrument the most.
2Put their dates for the next two months in your calendar.
3Adopt this rule: no open position in the thirty minutes before or after any of them.
4If you use indicators, cut down to two at most, and be able to explain in one sentence what each one calculates.
12 Choosing your broker
Your broker is the intermediary all of your money passes through. It is therefore the most consequential decision of your whole journey — and, paradoxically, the one most beginners make in a few minutes, on the strength of an ad.
Regulation, before anything else
A broker regulated in the European Union is bound by obligations that protect you in concrete ways: your funds segregated in accounts separate from its own, a cap on leverage, negative balance protection, and membership of a compensation scheme in case of bankruptcy.
These protections are not theoretical. When the Swiss franc was abruptly unpegged in 2015, clients of unprotected brokers ended up with negative balances — that is, debts owed to their broker. Negative balance protection, mandatory in Europe today, exists precisely because of that episode.
What to check
What you need
How to check it
Regulation
AMF, CySEC, BaFin, FCA or equivalent
the regulator's public register, not the broker's website
Segregation of funds
mandatory
terms and conditions
Negative balance
protection guaranteed
terms and conditions
Leverage offered
30:1 maximum in Europe
a 1:500 offer means a broker outside EU regulation
Withdrawals
free, within a few days
user reviews, forums
Track record
several years in business
the company's incorporation date
The most reliable warning sign. A broker that phones you to push you into depositing more, that offers you a "personal adviser", or that hands out deposit bonuses is not running an intermediary's business. It lives off your losses. Serious brokers do not cold-call: they charge a spread or a commission and have no interest in you losing, since a client who survives pays them for longer.
The platform
MetaTrader 4 and 5 remain the Forex standards: robust, universal, and open to automation. cTrader offers more transparent execution. TradingView has established itself for chart analysis and connects to many brokers.
This choice matters less than the broker. A platform takes a few weeks to learn; a dubious broker can cost you your entire deposit. Take the one your regulated broker offers, and do not make it a selection criterion.
The demo account
Every serious broker offers one, free and unlimited. It reproduces real execution conditions with fake money. It is your compulsory training ground.
One honest caveat: a demo does not reproduce emotion. Watching a paper loss of €300 and watching a real loss of €300 do not put you in the same state. The demo is there to make the technical moves automatic — placing an order, working out a size, setting a stop. It does not prepare you for the pressure. That is why the move to a live account is made with deliberately trivial amounts.
Worth remembering
European regulation comes before any other criterion: segregation of funds, capped leverage, negative balance protection.
A broker that cold-calls, hands out bonuses or offers 1:500 lives off your losses.
A demo makes the moves automatic but does not prepare you for the emotion. The move to a live account is made with trivial amounts.
Put it into practice
Check your broker, or choose one
1If you already have an account, look up its license number in the public register of the regulator it claims. If it is not there, withdraw your funds.
2Check the terms and conditions for segregation of funds and negative balance protection.
3Open a demo account and spend at least one full month on it before depositing any real money.
4When you go live, start with an amount you could lose in full without it changing your month.
13 Buying, selling, and knowing yourself
One last technical point — the ability to profit when price falls — then the subject that decides everything: what happens in your head when money is at stake. It is the part nobody wants to read and everybody ends up facing.
Long and short
Going long means buying on a bet that price will rise: you buy at 1.0800, you sell at 1.0900, you pocket the difference. It is intuitive.
Going short means selling an asset you do not own, on a bet that price will fall. The mechanism is surprising at first: you sell at 1.0800, and if price drops to 1.0700 you buy back cheaper and pocket the difference. Technically, your broker lends you the asset for the duration of the trade.
This symmetry is a real advantage: it lets you work in both directions and spares you from waiting for uptrends. It carries a risk asymmetry you need to know about: when buying, your maximum loss is bounded by price falling to zero, whereas when selling, price can in theory rise without limit. In practice, a stop-loss settles the question.
The four reactions that cost the most
These mechanisms are not personal weaknesses: they are normal human reactions, well documented, and they affect everyone. Knowing them does not remove them, but it lets you recognize them when they show up — and that is already the main thing.
1Fear of missing out. You see a clean move start without you and you enter late, often at the worst moment, with no valid setup. It is the most common cause of a beginner's losses.
2Refusing to accept a loss. A position goes against you and you widen the stop, or you remove it. You turn a planned, bearable loss into an unplanned one that can take everything.
3The need to win it back. After a loss, you immediately open a bigger position to make up for it. This is the mechanism that empties accounts fastest, and it is recognizable by one specific feeling: urgency.
4Overconfidence. After a run of wins, you increase your sizes and loosen your criteria. The run always ends, and it ends on an oversized position.
The only remedy that really works. None of these reactions can be fought with willpower at the moment it appears — that is precisely the moment willpower is unavailable. You neutralize them beforehand, with written rules and physical constraints: a stop placed at the same time as the entry, a daily loss limit that closes the platform, a compulsory break after every loss. You do not make yourself disciplined; you organize things so that you do not need discipline.
What you can reasonably expect
A word on timescales, because unrealistic expectations are themselves a cause of failure. Learning the basics takes a few weeks. Developing a method and testing it properly takes several months. Reaching consistency on a live account often takes one to two years.
That is neither discouraging nor unusual: it is the order of magnitude of any demanding technical skill. Nobody expects to play an instrument after three months. What is particular about trading is that you can lose money while learning — hence the insistence on the demo account and on trivial amounts at the start.
Worth remembering
Going short lets you profit when price falls; the stop-loss settles its theoretical risk asymmetry.
Fear of missing out, refusing a loss, the need to win it back, overconfidence: four normal and costly reactions.
They are not fought with willpower in the moment, but with rules laid down while you are calm and with physical constraints.
Put it into practice
Identify your dominant reaction
1Read the four reactions again and honestly name the one that looks most like you. There is almost always one that dominates.
2Write down the physical constraint that would neutralize it: a compulsory break, closing the platform, a stop order entered at the same time.
3Put that constraint in place today, before you need it.
4Note your emotional state before every position for two weeks, in a single word. A pattern will emerge.
14 Your roadmap
You now have the vocabulary and the mechanics. This final chapter pulls the module together into a realistic progression plan, and tells you honestly where you stand.
What you can do at this point
Describe what a trade is and name its five stages
Tell trading and investing apart, and know which one fits your situation
Choose a market that fits the hours you actually have
Place the four order types without hesitating
Work out what a trade costs you in fees
Read a candle and identify the state of the market
Draw support and resistance zones
Check that a broker is regulated
Name the emotional reactions that threaten you
What you are still missing
It needs saying plainly: this module has given you no method. You can read a chart, but you cannot yet decide what to do with it. And above all, you have not yet seen the part that decides whether you survive.
The next module, Risk Management, is the one that matters most. That is not a turn of phrase: you can survive a long time with mediocre analysis and well-managed risk, never the other way around. Do not skip it to go straight to the strategies, however strong the temptation.
A six-month progression
Period
Target
What you actually do
Month 1
Foundations
Finish Basics and Risk Management. Open a demo account. No trades.
Month 2
Observation
One instrument, one time window. Keep a journal, place no orders.
Month 3
First trades
On demo, two setups at most, position size calculated every time.
Month 4
Measurement
Fifty trades on demo. Work out your expectancy. One single adjustment.
Month 5
Minimal live account
Go live with trivial amounts. Exactly the same rules.
Month 6
Consolidation
Monthly review. Increase size only if expectancy holds.
This schedule is deliberately slow. Every step skipped is paid for later, and it always costs more than the time it would have taken.
The one thing to remember from this module. You are not behind. Trading is not a race, and nothing you might miss this month is irreplaceable — the markets will still be there. The only real urgency is not to commit money before you understand what you are doing. Everything else can take as long as it takes.
Worth remembering
This module gives you the vocabulary and the mechanics, not a method.
The Risk Management module is the one that decides whether you survive. It comes before the strategies.
Allow six months for a sound progression. Every step skipped is paid for later, and costs more.
Put it into practice
Move on cleanly
1Mark as learned the lessons in this module you could explain to someone else. Read the others again.
2Open the Risk Management module and read it all the way through before placing a single order, even on demo.
3Open a demo account with a regulated broker and leave it running: you will need it from the next module onwards.
4Take the assessment test again when you have finished both modules. It will tell you plainly what you have actually learned.