No other chapter in this course carries as much weight. You can survive a long time with mediocre analysis and solid risk management; the reverse is never true. This module gives you the handful of calculations that separate a controlled activity from an account that empties out.
0/12
01 Why most people lose
Before you learn to manage risk, you need to understand exactly what makes most beginners fail. It is almost never the analysis. It is an arithmetic mechanism you can take apart in a few minutes — and once you have seen it, you can no longer ignore it.
Let's start with the official figure, the one European brokers are legally required to display. According to the reports published by the AMF, France's financial regulator, and by ESMA, the European securities regulator, between 74% and 89% of retail accounts lose money on CFDs. That number is not a moralist's opinion: it is a statistic each broker computes on its own client base and publishes under regulatory obligation.
The usual reading of that figure is discouraging. It is also incomplete. What the statistic does not say is how those accounts lose. And there, the mechanism is remarkably consistent.
The real culprit is not where you look for it
The beginner's intuition is that losing comes from being wrong. The answer would then be to be right more often: better indicators, a better method, better timing. That intuition is false, and it is the most useful piece of news in this whole module.
One trader can be right six times out of ten and ruin their account. Another can be right four times out of ten and make money steadily. The difference is not the win rate, but the size of the wins relative to the losses, and the share of capital committed each time.
What the beginner does
They put a large share of their capital on the positions they are "sure" about
They cut their winners short, afraid of watching the gains disappear
They let their losses run, hoping for a comeback
They increase their size after a loss, to win it back
What the professional does
They commit the same fraction of capital on every position, without exception
They let their winners run according to a plan written in advance
They cut their losses at a level decided before entering
They reduce their size after a losing streak, never the other way round
The asymmetry that dooms accounts
Here is the tipping point. Losing and winning back are not symmetrical operations. When you lose a fraction of your capital, what is left is smaller — and it is on that reduced capital that the next gain has to work. The percentage needed to get back to break-even is therefore always higher than the percentage lost.
The formula is simple, and you should be able to work it out on your own after this lesson: if you lose a proportion p of your capital, the gain g needed to get back to your starting point is g = p ÷ (1 − p).
Loss taken
Capital left out of €10,000
Gain needed to get back
Interpretation
−10%
€9,000
+11.1%
Recoverable in a few decent weeks
−25%
€7,500
+33.3%
A good year of performance, for no net gain
−50%
€5,000
+100%
Doubling your capital, only to get back to square one
−75%
€2,500
+300%
Beyond what any fund achieves
−90%
€1,000
+900%
Statistically, the account does not come back
Exact calculations: gain needed = loss ÷ (100 − loss). No market assumption is involved — this is arithmetic.
Look at the third row. A loss of half demands a doubling. And doubling capital is a performance very few professional managers achieve in a year. So the beginner who loses half of their account has to pull off, just to get back to their starting point, what a professional would consider an exceptional year.
This is exactly the moment the second mistake happens: to catch up faster, they increase their position size. Which speeds up the fall instead of correcting it.
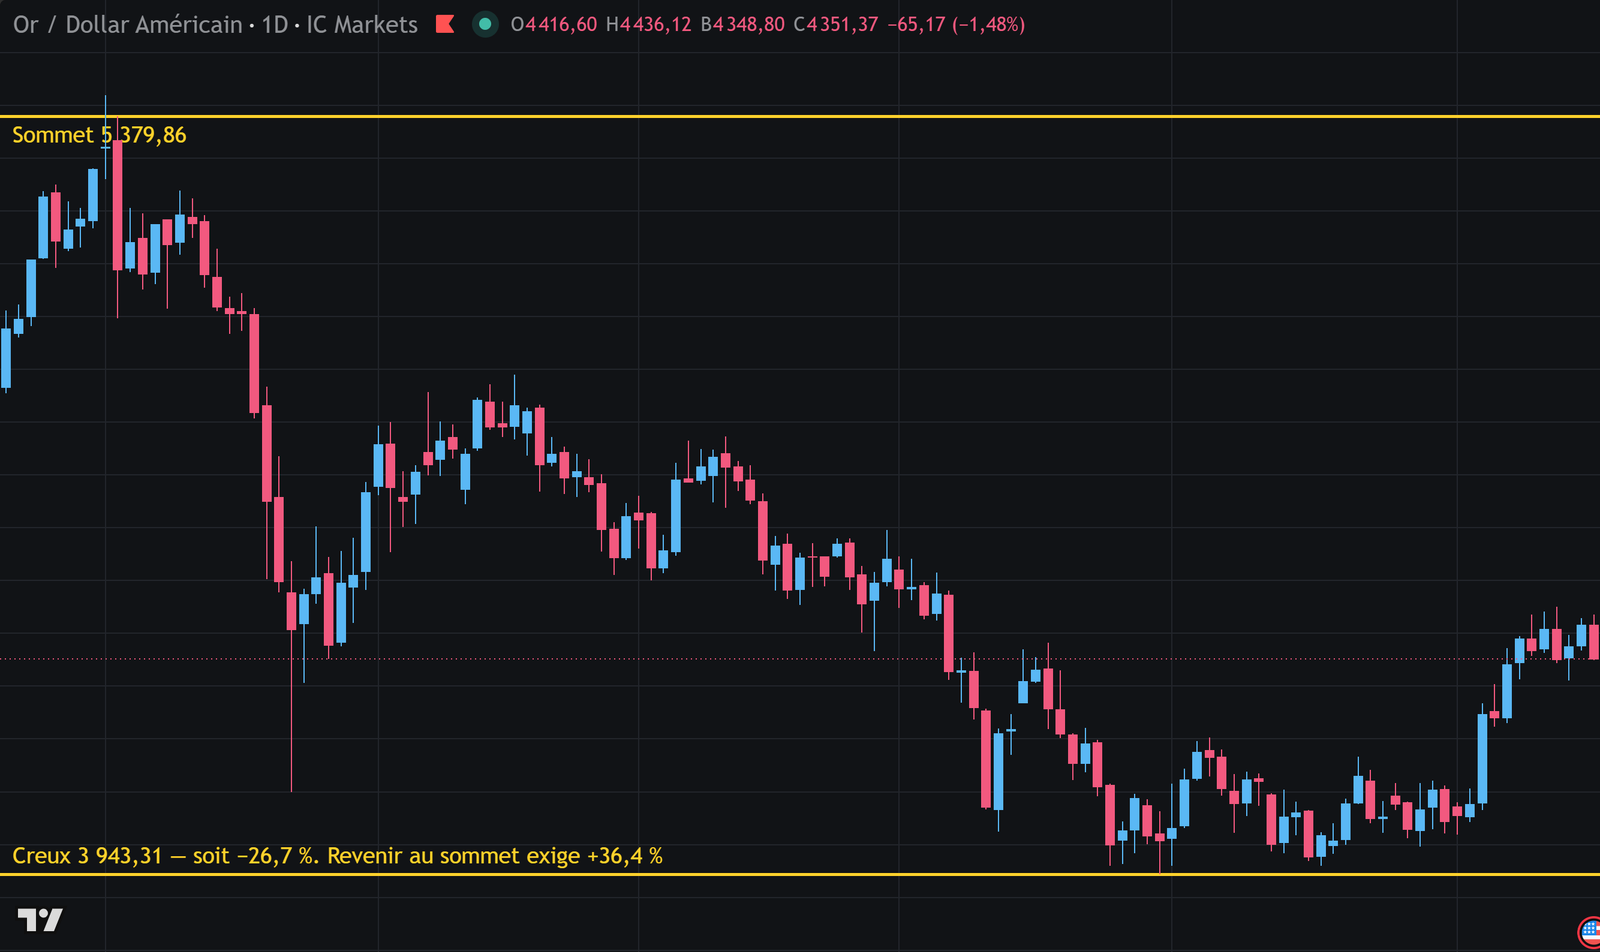
The asymmetry in a real case. From its high to its low, gold lost 26.7%. To get back to its starting point, gaining 26.7% is not enough: it needs +36.4%. The deeper the loss, the wider the gap between the two.XAU/USD, daily — chart by TradingView. Past data, with no predictive value.
Here is the good news. If the loss comes from a mechanism, then a mechanism corrects it. You do not need to become better at analysis to stop losing this way — you need to cap what each position can cost you. That is exactly what the eleven chapters that follow are about.
Worked example
Two traders, the same market, two outcomes
Sophie and Thomas each open a €10,000 account. They take exactly the same twenty positions, with the same entries and the same exits. The only difference is the share of capital they risk each time.
Inputs
Starting capital
€10,000
Positions taken
20
Winning positions
8 (40%)
Average win
+2R
Average loss
−1R
Sophie's risk
1% of capital
Thomas's risk
10% of capital
Calculation
Result in risk units: (8 × +2R) + (12 × −1R) = +16R − 12R = +4R
Sophie — 1R is worth €100: she ends at €10,000 + (4 × 100) ≈ €10,400
Thomas — 1R is worth €1,000 at the start, but his capital moves with every trade
Thomas takes a run of 5 losses in a row (ordinary over 20 trades at 40%)
After those 5 losses at 10%: 10,000 × 0.9⁵ ≈ €5,905
His capital is down 41% — and every gain after that works on this reduced base
ResultSophie: ≈ €10,400 · Thomas: ≈ €6,900
Same analysis, same trades, same exits. The only parameter that changes is the fraction risked. That parameter — and it alone — decides who stays in the game.
Worth remembering
The win rate does not determine profitability: position size and the reward-to-risk ratio do.
Losing p% of your capital requires gaining back p ÷ (1 − p): the gap widens sharply beyond 30%.
The dominant cause of failure is mechanical, so it can be corrected without becoming a better analyst.
Put it into practice
Measure your real exposure
1Open your account history, live or demo. If you have neither, take the last twenty positions you would have taken on paper.
2For each one, work out what the loss came to as a percentage of your capital at the time you entered — not in euros, as a percentage.
3Write down the highest value you find. That is your real exposure, the one that decides whether you survive.
4If that number is above 2%, change nothing else for now: the next chapter deals with exactly this point.
02 The 1% rule
It is the most quoted rule in trading, and the most misunderstood. It does not say to invest 1% of your capital. It says never to accept losing more than 1% on a single position. The distinction changes everything, and it has arithmetic consequences we are going to work through.
Let's state it precisely. On a given account, you set in advance the maximum amount a position can cost you if it goes wrong. That amount is a fixed percentage of your capital, usually between 0.5% and 2%. It depends neither on your confidence in the trade, nor on what happened the day before.
On a €10,000 account, risking 1% means no position can cost more than €100. That says nothing about the amount committed: depending on how far away your stop is, those €100 of risk can correspond to a €2,000 position or a €50,000 one. We will look at that calculation in the next chapter.
The most common confusion. "I risk 1%" is not "I invest 1%". The percentage applies to the potential loss, never to the size of the position. A trader who commits €30,000 with a tight stop may well be risking only €100.
Why this number and not another
The choice of 1% is not arbitrary: it follows from how well an account withstands losing streaks. A losing streak is not an accident, it is a statistical certainty. With a win rate of 50%, six losses in a row happens about once in sixty-four. Over a few hundred positions a year, it will happen several times.
So the question is not whether you will go through a losing streak, but what state your account will be in when you come out of it. That is what the following table shows.
Risk per position
5 losses in a row
10 losses in a row
20 losses in a row
0.5%
−2.5%
−4.9%
−9.5%
1%
−4.9%
−9.6%
−18.2%
2%
−9.6%
−18.3%
−33.2%
5%
−22.6%
−40.1%
−64.2%
10%
−41.0%
−65.1%
−87.8%
Compounded losses: capital × (1 − risk)^number of losses. The twenty-loss column is not theoretical — it happens in the career of every active trader.
Read the 10% row. Ten losses in a row take two thirds of the account. At that stage you would have to triple what is left to get back to your starting point — we saw in the previous chapter what that means.
Now read the 1% row. The same ten losses cost less than a tenth of the capital. The account is intact, so is your ability to decide, and above all: the next twenty trades work on a base that is barely touched.
Which percentage for you
There is no universal answer, but there is a sensible progression, and it always runs from the more cautious to the less cautious — never the other way round.
Your situation
Recommended risk
Reason
Demo account, first months
1%
Reproduce the constraints of live trading from the start
Starting out live
0.5%
Emotion doubles the mistake: you compensate by reducing
Method tested over 100+ trades
1%
The reference point, when behavior is stable
After 3 losses in a row
0.5%
You reduce during a rough patch, you do not double
Never, however confident you are
> 2%
Beyond that, a normal streak becomes a serious accident
The "obvious trade" trap. Sooner or later, a setup will look so clear that you will consider doubling your stake. Note that moment when it comes: conviction does not change the probability, it only changes how you perceive it. The heaviest losses in most trading careers came on positions the trader was certain about.
The same number of losses, four different consequences. The green curve can still be repaired; the red one cannot. It is this single parameter — the percentage risked — that decides which one you follow.
Worked example
The same account, two risk rules, over a year
A trader takes 200 positions over the year, with a win rate of 45% and a reward-to-risk ratio of 1.8 to 1. The method is therefore profitable. We compare two risk disciplines, all else being equal.
Maximum drawdown during the worst streak: 1 − 0.99⁹ ≈ −8.6% — bearable
At 5% risk — 1R ≈ €500: a far higher theoretical gain…
…but drawdown during the worst streak: 1 − 0.95⁹ ≈ −37%
And at −37%, it takes +59% just to get back to break-even
Result1%: about +50% with a drawdown of 9% · 5%: high volatility, drawdown of 37%
The method is the same, the expectancy is the same. At 5%, the trader makes more on paper — but he has to sit through a 37% drawdown without deviating from his plan. Almost nobody can, and that is where the plan gets abandoned, at the worst moment.
Worth remembering
The rule applies to the maximum loss you accept, never to the amount committed.
Between 0.5% and 2% depending on your experience. Above 2%, a normal losing streak becomes a serious accident.
You reduce risk after a losing streak. You never increase it to win the money back.
Put it into practice
Set your percentage, write it down
1Choose your percentage from the table above. If you are unsure, take 0.5%: nobody has ever failed for risking too little.
2Work out what that percentage comes to in euros on your current capital. That amount is your ceiling per position.
3Write this sentence somewhere you can see while you trade: "Maximum loss per position: €___. No exceptions."
4Check that amount whenever your capital changes significantly — upwards as well as downwards.
03 Calculating position size
This is the central calculation of the job, and it fits on one line. Until it is automatic for you, you are not controlling your risk — you are estimating it. We are going to set it out, work it through in full on three different markets, then you will do it on your own.
The reasoning goes like this. You know how much you are willing to lose, in euros: that was the previous chapter. You know at what price you will exit if the market goes against you: that is your stop. What remains is to work out the quantity to buy so that, if the stop is hit, the loss is exactly the amount you accepted — no more, no less.
The formula, once and for all. Position size = Amount risked ÷ (Stop distance × Value of one point). All three terms are known before you enter. If one of them is missing, you are not ready to place the order.
The three terms, one by one
The amount risked follows from your percentage: capital × percentage. On €10,000 at 1%, it is €100. It is not up for discussion at the moment of the trade.
The stop distance is the gap between your entry price and your exit price if the trade fails. It is expressed in pips on Forex, in points on indexes, in percent or in price units on stocks and crypto. The market dictates it — it goes where your scenario becomes wrong, never at a distance chosen to make the calculation convenient.
The value of one point depends on the instrument and the contract size. It is the only data you have to look up with your broker. On EUR/USD, a pip is worth about $10 per standard lot; on the CAC 40 as a CFD, a point is often worth €1 per contract.
The ordering mistake you must never make
Many beginners work in the wrong direction: they first pick a position size that seems reasonable to them, then place the stop where the risk looks acceptable. That is exactly the opposite of what you need to do.
The stop goes where the market puts it: below a support, beyond a low, at the exact point where your analysis would be invalidated. Position size is adjusted afterwards. If the calculation gives a ridiculously small size, it means the stop is too far away for your capital — and the correct answer is not to take the trade, not to move the stop closer.
The right approach
1. The market shows where to place the stop
2. Your capital sets the amount risked
3. The calculation gives the size
4. If the size is unusable, you skip the trade
The approach that ruins you
1. You pick a size that "seems about right"
2. You place the stop where the loss looks bearable
3. The stop ends up inside the market noise
4. It gets hit, then price moves back in the right direction
The calculation reads from left to right, and the order of the three steps is not negotiable: the market decides the stop, you decide the risk, arithmetic decides the size.
Worked example
The same €100 risk, on three markets
A €10,000 account, risk set at 1%, that is €100 per position. Here is the full calculation on three instruments whose conventions differ completely. Notice that the amount risked never changes.
Inputs
Capital
€10,000
Risk accepted
1% → €100
Case A — EUR/USD
stop 25 pips away
Case B — CAC 40 (CFD)
stop 40 points away
Case C — Bitcoin
entry $60,000, stop $58,200
Calculation
A — one pip is worth €10 per standard lot: 100 ÷ (25 × 10) = 0.40 lot
A — check: 25 pips × €10 × 0.40 = €100. Correct.
B — one point is worth €1 per contract: 100 ÷ (40 × 1) = 2.5 contracts
B — check: 40 points × €1 × 2.5 = €100. Correct.
C — stop distance: 60,000 − 58,200 = $1,800, or 3% of the price
C — quantity: 100 ÷ 1,800 = 0.0555 BTC
C — check: 0.0555 × 1,800 = €100. Correct.
Result0.40 lot · 2.5 contracts · 0.0555 BTC — three sizes, one single risk
Three markets, three quoting conventions, three quantities with nothing in common. And yet, in all three cases, if the stop is hit the loss is €100. That is exactly what the calculation guarantees: the position adapts to the market, the risk stays constant.
Worth remembering
Size = Amount risked ÷ (Stop distance × Point value).
The order is not negotiable: the stop first, the size second. Never the other way around.
A stop too far away for your account balance does not call for a closer stop, but for skipping the trade.
Put it into practice
Make the calculation automatic
1Open the position calculator on this site and redo the three cases above. You should get 0.40 lot, 2.5 contracts and 0.0555 BTC.
2Look up the point value with your broker for the two instruments you follow most closely. Write it down; you will need it on every trade.
3For one week, work out the size by hand before checking it with the calculator. The aim is for the answer to come to you without thinking.
4Add the check to your routine: distance × point value × size must always give back the amount you risked.
04 The reward-to-risk ratio
Once the loss is capped, the mirror question remains: how much are you aiming for? The ratio between what you hope to gain and what you agree to lose determines the win rate you need in order to be profitable. This is where trading stops being a matter of prediction and becomes a matter of arithmetic.
We write this ratio as R, for risk/reward. A 2R trade means the target sits at twice the stop distance. If you risk €100 and aim for €200, you are at 2R.
The value of this unit is that it makes your trades comparable. A €340 gain on one position and an €85 gain on another cannot be compared directly — but +2R and +2R can. You stop thinking in euros and start thinking in multiples of your risk, and that is what makes a method measurable.
The win rate you need
This is the most liberating table in the module. For each reward-to-risk ratio, it gives the percentage of winning trades at which you break even. Below it, you lose. Above it, you win.
Ratio
Break-even win rate
What it means
0.5R
66.7%
You need to be right two times out of three: very demanding
1R
50.0%
A coin toss, minus costs: unsustainable over time
1.5R
40.0%
You can be wrong three times out of five
2R
33.3%
One win in three is enough
3R
25.0%
One win in four is enough
5R
16.7%
One win in six is enough — but those wins are rare
Formula: break-even rate = 1 ÷ (1 + R). Brokerage fees and the spread come on top: allow a few points more in practice.
Stop for a moment on the 2R row. It says that with a target at twice your stop, you can be wrong two times out of three and still break even. That is a considerable piece of information for a beginner convinced that you have to "be right often".
It also explains why cutting your gains short is so destructive. Exiting at +0.5R for psychological comfort when the plan called for +2R raises the break-even rate from 33% to 67%. The method has not changed: it has simply become a losing one.
The ratio is not something you decide. You do not pick a 3R target because 3R is a nice number. The target goes where the market offers resistance, a liquidity zone, a technical level within reach. If the only credible target is at 1.2R, then the trade is worth 1.2R — or it is not worth taking.
The ratio is not everything
There is a mirror trap: systematically hunting for very high ratios. Aiming for 5R looks ideal on paper, since one win in six is enough. In practice, distant targets are rarely reached: price turns back before them, and the trade ends as a loss even though it was well in profit along the way.
The reward-to-risk ratio only means something when paired with the win rate actually observed on your method. It is the combination of the two that expectancy measures, the subject of the next chapter.
The bigger the gain you aim for compared with the loss you accept, the less often you need to be right. That is exactly why the win rate is a poor indicator on its own.
Worked example
The effect of an early exit
A trader follows a method whose plan calls for a 2R target, with a measured win rate of 40%. Out of discomfort, he gets into the habit of exiting at +1R as soon as the position is in profit. Here is what that one habit changes over a hundred trades.
Result+€2,000 by following the plan · −€2,000 by exiting too early
The entries are identical. The analysis is identical. The win rate is identical. Only the exit changes — and the method goes from clearly profitable to clearly losing. This is why the exit must be written down before the entry, not decided while the trade is running.
Worth remembering
Win rate needed = 1 ÷ (1 + R). At 2R, one win in three is enough.
Thinking in R rather than in euros makes your trades comparable and your method measurable.
The target goes on a level the market justifies, never on a round number chosen in advance.
Put it into practice
Measure your real ratio
1Go back over your last twenty trades. For each one, note the stop distance and the distance to the target you actually reached.
2Work out the ratio you really obtained, not the one you had planned. The gap between the two is your most immediate room for progress.
3Compare your win rate with the break-even rate for your average ratio. If you are below it, the problem is identified.
4Before each of your next trades, write down the ratio you are aiming for. If you cannot find a credible target beyond 1.5R, sit that one out.
05 Expectancy
This is the only metric that really answers the question "is my method profitable?". It combines the win rate and the reward-to-risk ratio into a single number. If you were to follow just one measure of your own trading, this would be it.
Expectancy measures what each of your positions earns you on average. It says nothing about the next trade — no statistic can — but it says everything about what a long run of trades taken with the same method will produce.
The formula. Expectancy = (Win rate × Average win) − (Loss rate × Average loss). Express gains and losses in R, and the result tells you directly how many R you earn per trade on average.
Reading the result
Positive expectancy means repetition works in your favor: the more trades you take with this method, the more the result converges toward a gain. Negative expectancy means the opposite, and no amount of discipline, no risk management can correct it — the method itself is what has to change.
This is a fundamental distinction, and often misunderstood. Risk management does not make a method profitable. It keeps you in the game long enough for an already profitable method to do its work.
Expectancy per trade
Over 200 trades at €100 of risk
Verdict
−0.20R
€−4,000
Losing method: to be corrected, not disciplined
0.00R
€0 before costs, negative after
Chance, minus the costs
+0.10R
€+2,000
Profitable but fragile: little margin for error
+0.25R
€+5,000
Solid. Most viable methods live here
+0.50R
€+10,000
Excellent, and rare over time
+1.00R
€+20,000
Be wary: sample too short, or measurement bias
The question of sample size
Expectancy calculated over ten trades is worth nothing. Over thirty, it gives an indication. Over a hundred, it starts to be reliable. This requirement is not a methodological detail: it is what separates an observation from an illusion.
The reason is variance. On a small sample, luck dominates method by a wide margin. A mediocre trader can show flattering expectancy over fifteen trades, and an excellent trader can show negative expectancy over the same stretch. Only repetition separates the two.
Why you need to keep a journal. Expectancy is not guessed, it is calculated — and it can only be calculated from recorded data. That is the most concrete reason to keep a trading journal, the subject of chapter 10. Without a journal, you have no way of knowing whether your method works.
Worked example
Two methods, two profiles, one honest comparison
Two traders present their results. The first leads with his win rate, the second with his reward-to-risk ratio. Expectancy settles it without being impressed by the sales pitch.
ResultA: +€1,000 · B: +€8,000 — for half as many winning trades
Method A wins two times out of three and earns eight times less. Remember that result the next time someone sells you a system that is "70% reliable": the win rate on its own means strictly nothing. Note too that B means putting up with two losses out of three — which is psychologically demanding, and explains why so many traders give up on a profitable method.
Worth remembering
Expectancy = (win rate × average win) − (loss rate × average loss), in R.
Negative expectancy is not corrected by discipline: it is the method that has to change.
Below a hundred trades, your expectancy mostly measures luck.
Put it into practice
Calculate your expectancy
1Gather at least thirty past trades, live or demo, each with its result expressed in R.
2Work out your win rate, your average win in R and your average loss in R.
3Apply the formula. Write down the result and the sample size next to it — the second qualifies the first.
4Redo this calculation every thirty trades. It is the only objective measure of your progress.
06 The performance drawdown
The drawdown — the dip between a peak in your account balance and the low that follows — is the measure of what you will have to put up with. Every profitable method produces one. Knowing in advance how deep it will go is what will let you avoid giving up at the worst moment.
Let us define it properly. If your account rises to €12,000, falls back to €10,200, then turns up again, the drawdown is €1,800, or 15% of the peak. That percentage is more meaningful than the amount: it is what determines the effort needed to recover, as we saw in the first chapter.
The important point is this: a drawdown is not a sign that the method has stopped working. It is the normal behavior of a method whose expectancy is positive but whose results are spread out. Confusing the two leads you to change method just before it picks up again.
Losing streaks are not anomalies
Many traders experience their first run of six losses as proof that something is broken. The table below shows that it is nothing of the sort: these streaks are mathematically expected, and their frequency can be calculated.
Win rate
Streak of 5 losses
Streak of 8 losses
Longest likely streak over 200 trades
30%
1 in 6
1 in 17
13 losses in a row
40%
1 in 13
1 in 60
10 losses in a row
50%
1 in 32
1 in 256
8 losses in a row
60%
1 in 98
1 in 1,526
6 losses in a row
Probability of a streak of n losses = (loss rate)^n. The last column gives the longest streak it is reasonable to expect over two hundred trades.
Look at the 40% row, which matches many solid 2R methods. Over two hundred trades in the year, a streak of ten losses in a row is expected. Not possible: expected. If your plan does not allow for that moment, it is your plan that is incomplete, not the market that is broken.
At 1% risk, those ten losses cost 9.6% of the account. That is uncomfortable and perfectly absorbable. At 5%, they cost 40% — and at that level, almost nobody keeps applying their method.
The threshold that counts is not a financial one. Your maximum bearable drawdown is not the one your account can take, but the one you can live through without changing your behavior. For most people, that threshold sits between 10% and 20%. Set your risk against that threshold, not against what the calculator allows.
Two drawdowns to tell apart
The relative drawdown is measured from the last peak in the account: it is the one you live with day to day, and the one that tests your discipline. The absolute drawdown is measured from your starting capital: it is the one that tells you whether you are still above your initial stake.
Both deserve to be tracked. An account can be up 30% in absolute terms while going through a 15% relative drawdown — a comfortable situation financially, but a testing one psychologically, and that is where mistakes happen.
This year ends at +18.4%. Seen from July, though, it looked like a failure — and that is precisely where most traders give up on a method that was working.
Worked example
A realistic year, month by month
Here is the path of an account whose method is profitable over the year. Note that the progress is nothing like linear, and that the worst moment comes in the middle — right at the point where many traders give up.
At that point, the account is up just +0.7% on the year
Aug to Dec: €10,065 → €11,840 — back above the earlier peak in October
Result+18.4% on the year, after living through a 12.1% drawdown
By July, this trader had worked seven months for a gain of 0.7%. That is the exact moment when you convince yourself the method does not work, when you raise your size to catch up, or when you change everything. All three reactions destroy the year. The fourth — changing nothing — saves it.
Worth remembering
A drawdown is a profitable method working normally, not a sign that it has failed.
Losing streaks can be calculated: at a 40% win rate, ten losses in a row are expected over two hundred trades.
Set your risk against the drawdown you can live through without changing your behavior, not the one your account can take.
Put it into practice
Plan for your worst case
1Estimate your win rate, then read off the table the losing streak expected over two hundred trades.
2Work out what that streak would cost at your current risk percentage: capital × (1 − risk)^n.
3Ask yourself honestly whether you would still apply your method exactly the same way after that drawdown. If the answer is no, reduce your risk now.
4Write the size of that expected drawdown into your plan. The day it happens, you will know it was accounted for.
07 The stop-loss
The stop-loss is the order that automatically closes your position at a price decided in advance. It is the only mechanism that makes your maximum loss certain rather than hoped for. Everything else in this module rests on it.
Without a stop, your loss has no ceiling: it depends on your ability to decide in the moment, at the very point where that ability is most degraded. With a stop, the loss is known before you even open. The position sizing of chapter 3 makes no sense without it either — the distance to the stop is its denominator.
There is no such thing as a "mental stop". Deciding to get out at a certain price without placing the order amounts to having no stop. When price reaches that level, you will not be in the same frame of mind as when you decided: you will find a reason to wait a little longer. That is the mechanism by which a planned €100 loss becomes a real €900 loss.
Where to place it
A stop goes where your scenario becomes false — not at a distance that suits the arithmetic, nor at an amount that feels bearable to you. If you buy because a support is holding, your scenario becomes false when that support gives way: the stop therefore goes just below it, with a margin for noise.
That margin is not optional. A stop placed exactly on the level will be swept away by the market's ordinary wicks. A stop placed a sensible distance below gives the level room to breathe.
Placement type
Principle
Who it suits
Technical
Below the last swing low, beyond a level
The benchmark: the market decides
By volatility (ATR)
1.5 to 2 times recent average volatility
Adapts automatically to market regimes
Time-based
Exit if nothing happens after n candles
A useful complement, never a substitute
Fixed amount
"I get out at −€50"
To be avoided: ignores market structure entirely
Three costly mistakes
Widening a stop while the position is open. This turns a planned loss into an unplanned one. If you catch yourself doing it, the position must be closed immediately: you are no longer following a plan, you are hoping.
Placing the stop on an obvious, round level. Levels that everyone can read concentrate orders, and price often goes looking for them before turning back. Shifting it slightly is enough to avoid the sweep wick.
Giving up on the stop because you have been taken out several times. Being stopped out just before price turns back is frustrating, but it is the normal cost of insurance. Removing the stop to avoid that frustration is like cancelling the policy because you paid the premium and never had a claim.
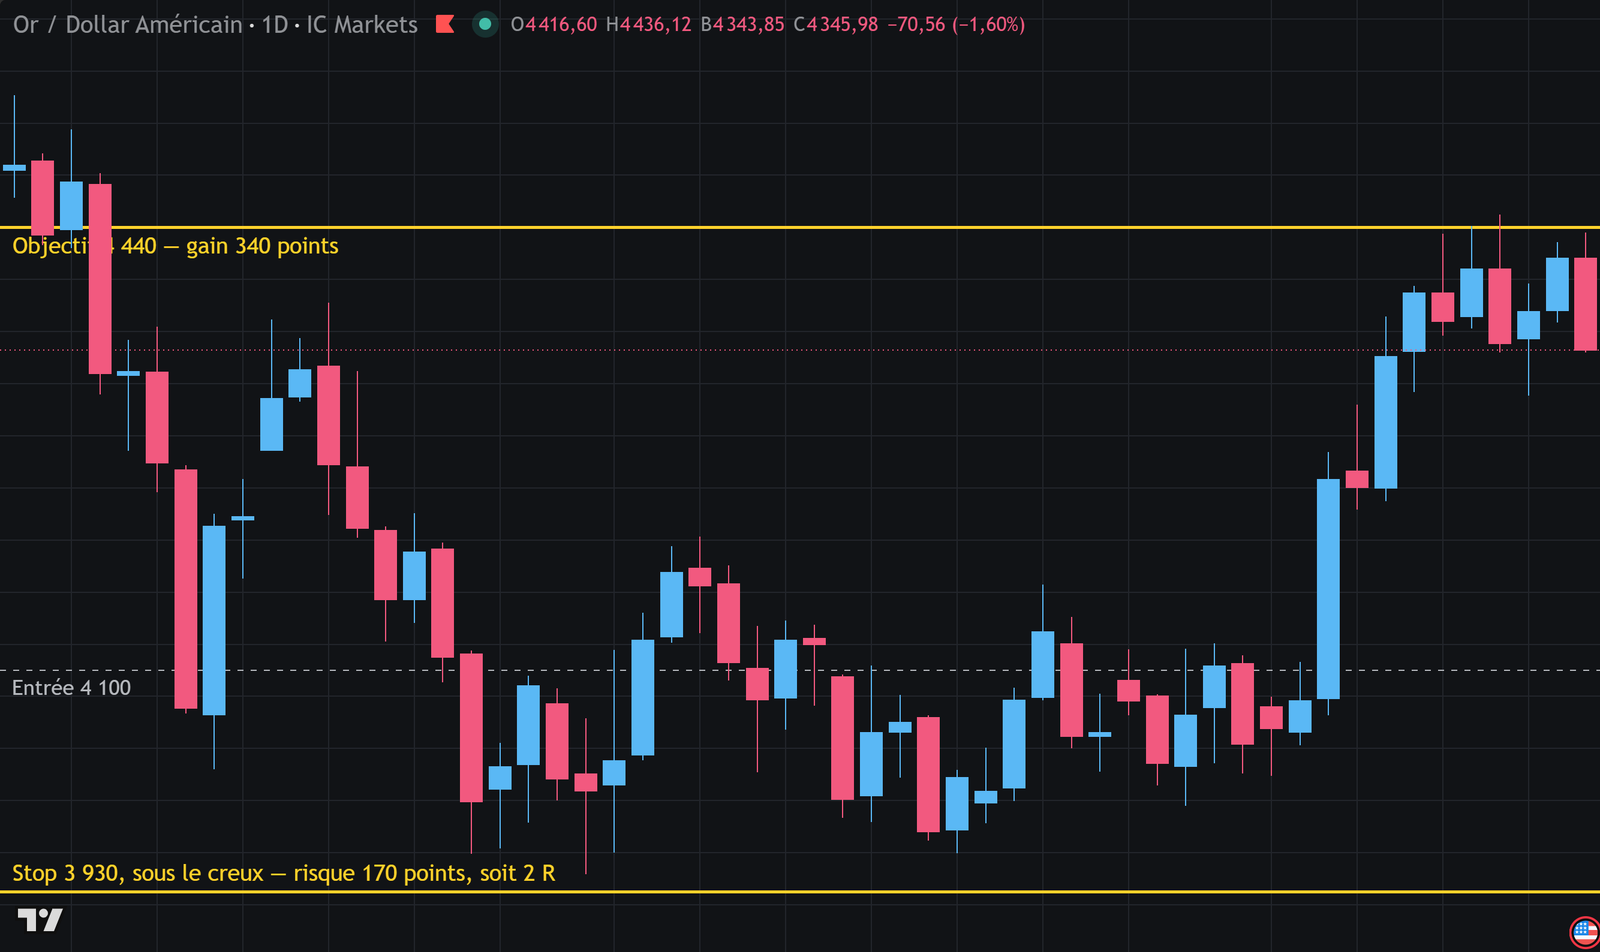
All three prices are decided before you open. The stop at 3,930 goes below the low, where the bullish scenario becomes false — it defines the risk, here $170, or 1R. The target at 4,440 rests on an earlier resistance and is worth 2R. The red zone is what you accept losing; the green, what you are aiming for.XAU/USD, daily — chart by TradingView. Past data, with no predictive value.
Worked example
What a missing stop costs, just once
A trader applies his method correctly for three months, risking 1%. On one position, he removes his stop because the market "is bound to come back". Here is the effect of that single lapse.
Inputs
Capital
€10,000
Planned risk per position
1% → €100
Trades in the quarter
60
Result of the 59 disciplined trades
€+2,100
The trade with no stop
loss allowed to run to −18%
Calculation
59 trades applied properly: capital €10,000 → €12,100
Position with no stop: 18% loss of capital → 12,100 × 0.18 = €2,178
Capital after: 12,100 − 2,178 = €9,922
The quarter goes from +21% to −0.8%
To get back to the €12,100 peak: it takes +22% on €9,922
ResultThree months of discipline wiped out by a single position
The ratio is brutal: fifty-nine correct decisions do not make up for one decision left uncapped. That is why the stop is not a comfort option but the condition on which all the rest depends. Note too that the loss was "only" 18% — many real stories end a great deal lower.
Worth remembering
The stop makes the maximum loss certain. Without it, no risk calculation means anything.
It goes where the scenario becomes false, with a margin for market noise.
A stop is never widened while the position is open. If the urge comes, the position is closed.
Put it into practice
Adopt the simultaneous-order rule
1From now on, no entry order goes in without its stop in the same operation. Many platforms let you enter both together: turn that option on.
2On your next ten trades, write down the stop price before you enter, and check afterwards whether it was respected to the letter.
3If you find even a single widening, go back to demo for a week. This reflex has to be in place before you commit real capital.
4Try volatility-based placement once (1.5 × ATR) and compare it with technical placement on the same setups.
08 Break-even and trailing stop
Once the position is open and the risk is capped, a second question comes up: what do you do when the trade moves in your favor? Two tools let you protect an unrealized gain without smothering the move. Neither of them is free, and it is that trade-off you need to understand.
Moving to break-even
Moving the stop to your entry price — what is called going break-even — cancels the risk on the position. If the market turns, you get out flat instead of losing. That is reassuring, and that is where the trap hides.
Going to break-even too early turns a trade that would have won into a flat one. Price breathes: it very often comes back to the entry zone before heading for the target. A stop moved up too quickly will be hit by that perfectly normal breathing.
Timing of the move
Observed effect
Recommendation
From +0.3R
Stopped out flat in most cases
Too early: price has not finished breathing
At +1R
A common compromise, workable
A good starting point for most people
At +1.5R
Lets the move settle in
Suits methods aiming at 3R and beyond
Never
The trade keeps its risk all the way through
Defensible if the target is close
None of these values is universal. The right answer comes from measuring, on your own trades, how far price typically comes back before moving on.
The trailing stop
The trailing stop moves up as price advances, locking in a growing share of the gain. It answers a real problem: you never know in advance how far a move will go, and a fixed target sometimes leaves a lot on the table.
Its cost is symmetrical: you will never exit at the high, since by design the stop is hit after a pullback. The trailing stop converts part of the theoretical maximum gain into the certainty of capturing the bulk of the move.
A middle way. Many traders close half the position at the fixed target and let the other half run with a trailing stop. You lock in a concrete result while keeping exposure to the long move. The price to pay is slightly heavier bookkeeping.
Fixed target
A clean exit, decided in advance
No decision to make during the trade
Lets exceptional moves get away
Suits ranging markets
Trailing stop
Captures long moves
Never exits at the high
Turns some winners into near-flat trades if price hesitates
Suits trending markets
Worked example
Three exit approaches on the same move
A long position is opened at 1.0800 with a stop at 1.0750, which is 50 pips of risk. Price rises to 1.0980 — a high at +3.6R — then falls back to 1.0870, where it settles. Here is the result for each approach.
Inputs
Entry
1.0800
Initial stop
1.0750 (50 pips = 1R)
Highest point reached
1.0980 (+3.6R)
Pullback to
1.0870
Risk committed
€100
Calculation
Fixed target at 2R (1.0900): reached during the rise → +€200
Trailing stop at 30 pips: trails up to 1.0950, hit on the pullback → +150 pips = +€300
Break-even from +0.5R then hold: the pullback to 1.0870 does not reach 1.0800 → position still open, +€140 unrealized
On this particular move, the trailing stop wins. In a ranging market where price had come straight back down, it would have made the trade flat where the fixed target banked +€200. None of the three approaches is better in absolute terms: you choose between them according to the market regime, and above all you test them on your own data before adopting one.
Worth remembering
Moving to break-even cancels the risk, but doing it too early turns winners into flat trades.
The trailing stop captures long moves at the cost of never exiting at the high.
The right approach depends on the market regime and is validated on your own data, not on a rule read somewhere.
Put it into practice
Find your breathing distance
1Take your last twenty winning trades. For each one, measure how far price came back against you before heading for the target.
2Calculate the average of those pullbacks, expressed in R. That is the typical breathing of your setups.
3Set your move to break-even beyond that value, never inside it.
4Test a mixed approach — half at the target, half trailing — on ten demo trades before using it live.
09 The capital protection rules
The previous chapters cap the risk of a single position. What remains is to cap the cumulative risk: that of a day, a week, a month. It is this second layer that keeps a bad session from becoming a bad year.
The problem is this. You can respect your 1% per position perfectly and still lose 8% in the day by taking eight trades in a row. Each one was within the rules; the whole was not. Cumulative limits close that gap.
They work like circuit breakers: when a threshold is reached, you stop. Not because the market has turned bad, but because experience shows that decision quality falls sharply after a run of losses.
The four caps
Limit
Usual value
What happens when it is reached
Per position
0.5 to 2%
The stop closes the position, automatically
Per day
3%
You close the platform until the next day
Per week
6%
You stop, you reread your journal, you do not trade again before Monday
Per month
10%
Back to demo until the following month, no exceptions
These values assume a risk of 1% per position. Scale them down proportionally if you risk less.
The daily limit is by far the most useful, because it intercepts the most destructive mechanism in trading: the urge to win it back within the session. After three losses in a row, the wish to "get it back before the close" is almost universal — and trades taken in that state are statistically the worst of all.
A maximum number of positions per day is worth adding to it. Many traders set a limit of three to five. Beyond that, you are generally no longer following a method: you are looking for action.
A limit is only worth something if it is mechanical. A rule you can break the moment it gets in your way is not a rule. Make it material: close the platform, cut off access, take the app off your phone for the day. The constraint has to exist outside your willpower of the moment.
The size-reduction rule
One last protection, often missing from beginners' plans: reduce your size during bad runs. After three losses in a row, go from 1% to 0.5% until you get two wins in a row. Then go back to normal.
The effect is twofold. Arithmetically, it slows the fall at the moment it is speeding up. Psychologically, it keeps you in the game with less at stake, which restores the quality of your decisions. It is the exact opposite of the natural reflex, which pushes you to increase size to catch up faster.
Four nested circuit breakers. Each has a material and immediate consequence, because a rule without a consequence is only an intention.
Worked example
A bad day, with and without a circuit breaker
A trader has a difficult session: six setups appear, five fail. We compare how it plays out with a 3% daily limit, then with no limit.
Inputs
Capital
€10,000
Risk per position
1% → €100
Daily limit
3%
Trades in the session
6 (5 losses, 1 win at 2R)
Actual sequence
L, L, L, L, W, L
Calculation
With the limit — trade 1: −€100 (running total −1%)
trade 2: −€100 (running total −2%)
trade 3: −€100 (running total −3%) → limit reached, session over
Loss for the day: €300, or −3%
Without the limit — all six trades are taken: (−100 × 5) + (+200) = −€300
…but in practice, the trader doubles up on trades 5 and 6 to win it back
Typical outcome in that case: (−100 × 4) + (+400) + (−200) = −€200… or (−100 × 4) + (−200) + (−200) = −€800
ResultWith a limit: −€300, capped · Without a limit: from −€200 to −€800, out of control
The point is not that the limit improves the day's result — sometimes it makes it worse, as here, where the winning trade is missed. The point is that it makes the loss bounded. You trade a little average performance for the certainty that no session can ever turn catastrophic. Over a career, that exchange comes out well ahead.
Worth remembering
Risk per position is not enough: you also have to cap the running total per day, per week and per month.
The daily limit intercepts the urge to win it back, which produces the worst trades.
You cut your size after a run of losses. The opposite reflex is the one that empties accounts.
Put it into practice
Install your circuit breakers
1Write down your four caps in euros, worked out on your current capital: per position, per day, per week, per month.
2Decide now what you do when each one trips — precisely, not vaguely. "I close the platform and go out for a walk" is worth more than "I'll be careful".
3Make at least the daily limit physical: a timer, closing the application, or a lock-out feature if your broker offers one.
4Add the reduction rule: after three losses in a row, risk halved until two wins in a row.
10 The trading journal
Without a journal, you cannot calculate your expectancy, identify what is costing you, or prove that you are improving. It is the least spectacular tool in the course and, by a wide margin, the one that produces the most effect. Here is how to keep one that actually serves a purpose.
The journal answers a question memory cannot handle: what is it, in the way I trade, that produces my results? Memory keeps the striking trades — the big loss, the spectacular win — and forgets the forty ordinary trades that are the ones setting the average.
A well-kept journal lets you answer precise questions: are my Friday trades profitable? Do my losses come mainly from counter-trend setups? Does my win rate drop when I take more than three positions a day? None of those answers is available without data.
What to record
A journal that is too heavy never gets kept. A journal that is too light is no use. The right compromise fits in one line per trade, entered in under a minute, with these columns.
Column
Example
What it is for
Date and time
14/08 · 15:30
Spot the time slots that work for you
Instrument
EUR/USD
Identify the markets where you are profitable
Direction
Buy
Detect a systematic bias
Setup
Pullback to H1 support
Know which setup actually pays
Entry · Stop · Target
1.0800 · 1.0750 · 1.0900
Reconstruct the ratio you planned
Result in R
+2.0R
The only unit that makes trades comparable
Plan followed?
Yes / No
The most instructive column in the journal
Emotional state
Calm / Rushed / Frustrated
Link deviations in discipline back to their cause
The decisive column. "Plan followed?" is the one that will teach you the most. A losing trade that followed the plan is a good trade: the method did its job. A winning trade that broke the plan is a bad trade, because it rewards behavior that will cost you dearly later. Always separate the quality of the decision from the quality of the result.
The review, without which the journal is no use
Recording is not enough: you have to read back. Set aside thirty minutes every week and one hour every month. The weekly review looks at deviations from discipline; the monthly review looks at the numbers.
In practice, a useful monthly review answers five questions: what is my expectancy for the month? Which setup worked best? Which setup is costing me money? How many times did I deviate from the plan, and why? What is the one thing I change next month?
That last question deserves to be taken seriously. Changing one thing at a time is what lets you measure its effect. Changing five parameters at once will leave you with no usable information at all.
Worked example
What a journal reveals in a month
A trader keeps his journal for forty trades. He thinks his problem comes from his entries. Sorting his data tells a different story.
Inputs
Trades recorded
40
Overall result
−1.2R
Trades that followed the plan
28
Trades that did not
12
Initial feeling
"my entries are bad"
Calculation
Subtotal for the 28 trades that followed the plan: +6.4R
Expectancy on that subset: 6.4 ÷ 28 = +0.23R per trade
Subtotal for the 12 trades that did not: −7.6R
Expectancy on that subset: −7.6 ÷ 12 = −0.63R per trade
Of the 12 deviations, 9 are logged as "frustrated" or "rushed"
8 of those 9 come after a loss, within the hour
ResultThe method wins (+0.23R). It is the deviations that ruin it.
The initial diagnosis was wrong: the entries are not at fault. The problem is an emotional reaction after a loss, inside an identifiable window of time. The fix is therefore precise and actionable — impose a thirty-minute break after every loss — where "improve my entries" would have led nowhere. That is exactly what a journal makes possible, and nothing else does.
Worth remembering
Without recorded data, you can neither measure your expectancy nor identify what is costing you.
One line per trade, entered in under a minute. A journal that is too heavy never gets kept.
Separate the quality of the decision from the quality of the result: a loser that followed the plan is a good trade.
Put it into practice
Open your journal today
1Create a table with the eight columns above. A spreadsheet is more than enough — the tool does not matter at all, the regularity does.
2Fill it in for your last five trades, from memory. It is imperfect, but it gets the habit started.
3Set a recurring reminder: thirty minutes of review every Friday, one hour on the last day of the month.
4At the first monthly review, change one single thing. Write down which one, and measure its effect the month after.
11 The trading plan
The plan is the document that turns intentions into rules. It is written when the markets are closed and you are calm, precisely so that it can be applied when they are open and you are not. Without it, every decision gets renegotiated under pressure.
A plan is not a statement of intent. "I will be disciplined" is not a rule: it is a wish. A rule can be checked after the fact — you can say without ambiguity whether it was followed or not. That is the criterion that separates a real plan from a useless piece of text.
The test is simple: show your plan to someone who does not trade, and ask them to judge, by looking at your trades, whether you followed it. If they cannot decide, your plan is not precise enough.
The seven sections
1Markets and hours. Which instruments you follow, what hours you trade, and when you do not trade. Ruling time slots out is as useful as allowing them.
2Setups. The description of what you are looking for, precise enough to be recognized without hesitation. Two or three setups are enough — at the start, that is even preferable.
3Entry rules. The conditions that have to be met to open. All of them must be present; there is no such thing as an "almost valid" entry.
4Stop and target placement. Where they go, on what logic, and what minimum ratio you accept.
5In-trade management. Moving to break-even, partial exit, trailing stop: decided in advance, never improvised.
6Risk limits. Per position, per day, per week, per month, and the maximum number of positions per day.
7Routine. What you do before the session, during it, and after. It is the part everyone neglects, and the part that holds the rest together.
A plan is only useful if it binds you
A plan you change mid-session serves no purpose at all. So the rule is this: the plan is only changed outside the session, in the cold light of day, and on the basis of the data in your journal — never in the heat of an open trade or a recent frustration.
That does not mean it is fixed. A plan necessarily evolves as you measure what works. But it evolves through documented decisions, one change at a time, not through successive drift.
The sign that should warn you. If you catch yourself justifying a trade after taking it, the plan did not do its job. A trade that follows the plan needs no justification: it ticks boxes decided in advance. The need to justify is the most reliable symptom of a deviation.
Worked example
A vague rule, a usable rule
Here is the same intention, written twice. The first version is what you find in most beginners' plans; the second is what to aim for.
Inputs
Intention
Only buy with the trend
Vague version
"I buy when the trend is up"
Usable version
see the working alongside
Quality criterion
checkable by a third party
Calculation
1. The reference timeframe is H4
2. The trend counts as up if the last two lows and the last two highs are both rising
3. I enter only on a pullback to the last rising low
4. The stop goes 10 pips below that low
5. The target goes on the last high, and I only enter if the ratio reaches at least 1.5R
6. I do not take this setup between 12:00 and 14:00 (Paris time)
ResultSix checkable criteria, against one sentence nobody can check
The difference is not one of style, it is one of kind. With the first version, there is no way of knowing after the fact whether you followed your plan — so no way of measuring anything, so no way of improving. With the second, every trade sorts itself without argument into followed or not followed, and the journal becomes usable.
Worth remembering
A rule is a sentence a third party can check you followed. The rest is intention.
The plan is written outside the session and only changed outside the session, on the basis of data.
Justifying a trade after the fact is the most reliable symptom of a deviation from the plan.
Put it into practice
Write the first version of your plan
1Block out an hour, markets closed. Write the seven sections, even imperfectly — an incomplete version is worth infinitely more than none.
2Read each rule again and ask the third-party question: could someone else check whether I followed it? Rewrite the ones that fail the test.
3Limit yourself to two setups to begin with. You will add more once these have been measured.
4Date the document. Every future change gets dated too, with the reason behind it and the journal data that justifies it.
12 The checking routine
This last chapter pulls the module together into a procedure you can apply. There is nothing impressive about it, and that is the point: it has to hold up when you are tired, rushed or frustrated. A good routine is one you follow on the bad days.
Before opening a position
Seven checks, in order. If a single one fails, the trade is not taken — and that is not up for case-by-case discussion.
1Does the setup match exactly one of those written in my plan?
2Is the stop placed where the market justifies it, and not at a distance that suits me?
3Does the target rest on a credible level, with a ratio of at least 1.5R?
4Have I calculated the position size, and checked that the maximum loss matches my percentage?
5Am I inside my limits for the day, both in cumulative losses and in number of positions?
6Am I calm? If I am frustrated, rushed, or trying to win back a loss, I stand aside.
7Am I ready to lose this amount without it changing anything at all about my day?
During the position
There is a single rule and it fits in one sentence: you never widen a stop. You can tighten it according to the plan, you can exit partially according to the plan, you can exit entirely if the scenario is invalidated before the stop. You do not widen it.
Close the chart if you catch yourself watching it non-stop. The trade is already fully defined: entry, stop, target, management. Watching it changes nothing about the outcome, but it clearly degrades your ability to stick to the plan.
After the position
1Record the trade in the journal, with the result in R and the note "plan followed: yes / no".
2Note the emotional state you felt at entry, in one word.
3If the plan was not followed, write in one sentence what happened. No justification, no leniency.
4Change nothing straight away. Changes are decided in review, on data, not after a trade.
The stopping thresholds
Situation
Response
3 losses in the day
Stop until the next day
Daily limit reached
Platform closed, no exceptions
3 losses in a row
Risk halved until 2 wins in a row
Monthly limit reached
Back to demo until the next month
Urge to "win it back"
Stop immediately. It is the most reliable signal there is.
What you have learned in this module. Capping the loss on a position, calculating a size, choosing a reward-to-risk ratio you can hold to, measuring an expectancy, anticipating a drawdown, placing a stop, protecting a gain, bounding your cumulative risk, keeping a journal, writing a plan. None of that predicts the market — and that is precisely the point. These tools do not make you win: they keep you in the game long enough for a profitable method to produce its effect.
Worth remembering
Seven checks before opening. One single failure, and the trade is not taken.
During the position: you only apply what was decided. No new decision is improvised.
The urge to win it back is the most reliable stop signal there is. It is not up for negotiation.
Put it into practice
Make the routine physical
1Print the seven pre-trade checks and put them next to your screen. Not in a file: in front of your eyes.
2For twenty trades, tick them off physically one by one. The aim is to make the gesture automatic, not to find it elegant.
3Schedule your two recurring reviews: thirty minutes on Friday, one hour at the end of the month.
4Now move on to the course assessment test. It covers every module and will tell you plainly what you have mastered and what you have not.